spectrochempy.plot_multiple
- plot_multiple(datasets, method='scatter', pen=True, labels=None, marker='AUTO', color='AUTO', ls='AUTO', lw=1, shift=0, **kwargs)[source]
Plot a series of 1D datasets as a scatter plot with optional lines between markers.
- Parameters:
method (
stramong [scatter, pen]) – Method to use for plotting.pen (bool, optional, default: True) – If method is scatter, this flag tells to draw also the lines between the marks.
labels (a
listofstr, optional) – Labels used for the legend. The length of the list must be equal to the number of datasets to plot.marker (
str, list` osstrorAUTO, optional, default: ‘AUTO’) – Marker type for scatter plot. If marker is not provided then the scatter type of plot is chosen automatically.color (
str, list` osstrorAUTO, optional, default: ‘AUTO’) – Color of the lines. If color is not provided then the color of the lines is chosen automatically.ls (
str,listosstrorAUTO, optional, default: ‘AUTO’) – Line style definition. If ls is not provided then the line style is chosen automatically.lw (
float,list`of `floats, optional, default: 1.0) – Line width. If lw is not provided then the line width is chosen automatically.shift (
float,list`of `floats, optional, default: 0.0) – Vertical shift of the lines.**kwargs – Other parameters that will be passed to the plot1D function.
Examples using spectrochempy.plot_multiple
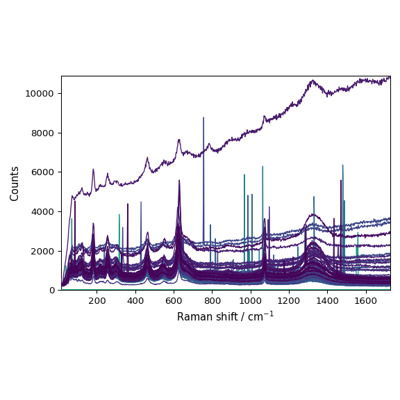
Using plot_multiple to plot several datasets on the same figure