Note
Go to the end to download the full example code.
Savitzky-Golay derivatives on a synthetic spectrum
This example shows how to compute smoothed derivatives with the public
differentiate() interface. The calculation is delegated to the
Savitzky-Golay filter and illustrates the automatic coordinate-aware scaling
introduced in SpectroChemPy 0.12.5.
The Savitzky-Golay algorithm assumes a uniformly spaced coordinate.
When delta is omitted, the signed spacing is
automatically detected from the coordinate. The resulting units follow
the physical rule source_units / coordinate_units**derivative_order.
import spectrochempy as scp
Build a synthetic absorbance spectrum
We construct a smooth absorbance band on a wavenumber axis and add a small amount of noise so that the derivative is not trivially exact.
x = scp.Coord.linspace(500.0, 3500.0, 500, title="wavenumber")
x.units = "1/centimeter"

# Gaussian-like band centred at 2000 cm⁻¹
# (scp.gaussian uses FWHM; sigma = FWHM / (2*sqrt(2*ln2)))
sigma = 300.0
mu = 2000.0
fwhm = 2.35482 * sigma
y = scp.gaussian(x, ampl=1.0, pos=mu, width=fwhm, normalized=False)

# Add a small amount of deterministic Gaussian noise
noise = scp.normal(loc=0.0, scale=0.005, size=x.size, seed=42)
ds = scp.NDDataset(y.data + noise.data, units="absorbance")
ds.set_coordset(x=x)
ds.name = "synthetic band"
Smoothing
deriv=0 (the default) performs pure smoothing. A larger window
removes more noise but may also distort sharp features.
ds_smooth = scp.savgol(ds, size=15, order=3, deriv=0)

ax = ds.plot(color="b", lw=1, label="noisy", figsize=(8, 4))
ax = ds_smooth.plot(clear=False, color="r", lw=2, label="smoothed")
ax.set_title("Savitzky-Golay smoothing (size=15, order=3)")
ax.set_xlabel("wavenumber / cm⁻¹")
ax.set_ylabel("absorbance")
_ = ax.legend(loc="best")

First derivative with automatic delta
derivative_order=1 triggers automatic detection of the signed spacing
from the coordinate. The result carries the units absorbance / cm⁻¹,
i.e. absorbance·cm.
ds_d1 = scp.differentiate(
    ds,
    derivative_order=1,
    size=15,
    polynomial_order=3,
)

# This is equivalent to scp.savgol(ds, size=15, order=3, deriv=1).

# The analytical derivative of a Gaussian is available for comparison:
# d/dx exp(-0.5*((x-mu)/sigma)^2) = -(x-mu)/sigma^2 * y
dy_dx = -(x.data - mu) / sigma**2 * y.data

# Plot the SG derivative and the analytical reference
ax = ds_d1.plot(color="r", lw=2, label="SG derivative", figsize=(8, 4))
ax.plot(x.data, dy_dx, color="b", ls="--", lw=1, label="analytical")
ax.set_title("First derivative (size=15, order=3)")
ax.set_xlabel("wavenumber / cm⁻¹")
ax.set_ylabel(f"derivative / ({ds_d1.units})")
_ = ax.legend(loc="best")

Descending coordinate
When the coordinate is stored in descending order (common for
wavenumber data), the auto-detected delta is negative. The negative
spacing compensates for the reversed sample order, so the derivative
retains the correct physical dy/dx sign at a given wavenumber.
x_desc_data = x.data[::-1]
x_desc = scp.Coord(x_desc_data, title="wavenumber")
x_desc.units = "1/centimeter"
ds_desc = scp.NDDataset(y.data[::-1] + noise.data[::-1], units="absorbance")
ds_desc.set_coordset(x=x_desc)
ds_desc_d1 = scp.differentiate(
    ds_desc,
    derivative_order=1,
    size=15,
    polynomial_order=3,
)

ax = ds_desc_d1.plot(
    color="r", lw=2, label="SG derivative (descending)", figsize=(8, 4)
)
ax.plot(x_desc_data, dy_dx[::-1], color="b", ls="--", lw=1, label="analytical")
ax.set_title("First derivative on descending coordinate")
ax.set_xlabel("wavenumber / cm⁻¹")
ax.set_ylabel(f"derivative / ({ds_desc_d1.units})")
_ = ax.legend(loc="best")

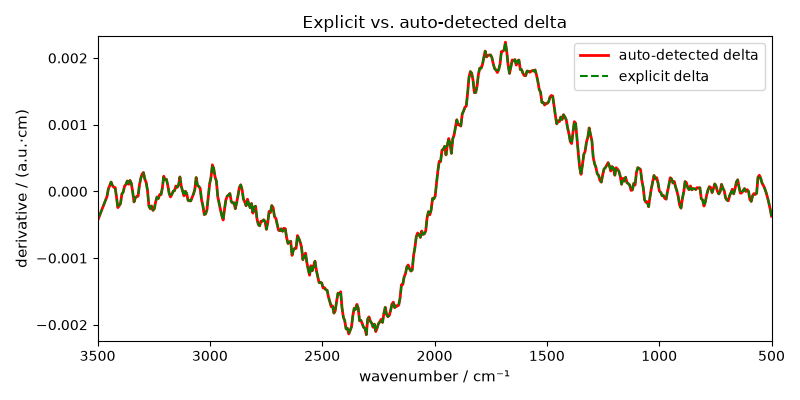
Explicit delta
An explicit delta disables auto-detection. The value is passed to
SciPy with its sign and is interpreted in the unit of the coordinate.
Here we supply the exact spacing (positive, because the coordinate is
ascending) and obtain the same result as the automatic path.
delta = float(x.data[1] - x.data[0])
ds_d1_explicit = scp.differentiate(
    ds,
    derivative_order=1,
    size=15,
    polynomial_order=3,
    delta=delta,
)

# Plot the explicit-delta result on top of the auto-detected one
ax = ds_d1.plot(color="r", lw=2, label="auto-detected delta", figsize=(8, 4))
ax = ds_d1_explicit.plot(
    clear=False, color="g", ls="--", lw=1.5, label="explicit delta"
)
ax.set_title("Explicit vs. auto-detected delta")
ax.set_xlabel("wavenumber / cm⁻¹")
ax.set_ylabel(f"derivative / ({ds_d1.units})")
_ = ax.legend(loc="best")
Uncomment the following line to display all figures when running the script directly with Python.
# scp.show()
Total running time of the script: (0 minutes 0.605 seconds)