The NDDataset object
The NDDataset is the main object use by SpectroChemPy.
Like numpy ndarrays, NDDataset have the capability to be sliced, sorted and subject to mathematical operations.
But, in addition, NDDataset may have units, can be masked and each dimensions can have coordinates also with units. This make NDDataset aware of units compatibility, e.g., for binary operation such as additions or subtraction or during the application of mathematical operations. In addition or in replacement of numerical data for coordinates, NDDataset can also have labeled coordinates where labels can be different kind of objects (strings, datetime, numpy nd.ndarray or other NDDatasets, etc…).
This offers a lot of flexibility in using NDDatasets that, we hope, will be useful for applications. See the See the Examples for additional information about such possible applications.
Below (and in the next sections), we try to give an almost complete view of the NDDataset features.
[ ]:
As we will make some reference to the numpy library, we also import it here.
[1]:
import numpy as np

import spectrochempy as scp

|
SpectroChemPy's API - v.0.7.0 © Copyright 2014-2025 - A.Travert & C.Fernandez @ LCS |
We additionally import the three main SpectroChemPy objects that we will use through this tutorial
[2]:
from spectrochempy import Coord
from spectrochempy import CoordSet
from spectrochempy import NDDataset
For a convenient usage of units, we will also directly import [ur]((#Units), the unit registry which contains all available units.
[3]:
from spectrochempy import ur
Multidimensional array are defined in Spectrochempy using the NDDataset object.
NDDataset objects mostly behave as numpy’s numpy.ndarray (see for instance numpy quickstart tutorial).
However, unlike raw numpy’s ndarray, the presence of optional properties make them (hopefully) more appropriate for handling spectroscopic information, one of the major objectives of the SpectroChemPy package:
mask: Data can be partially masked at willunits: Data can have units, allowing units-aware operationsCoordSet: Data can have a set of coordinates, one or several by dimensions
Additional metadata can also be added to the instances of this class through the meta properties.
1D-Dataset (unidimensional dataset)
In the following example, a minimal 1D dataset is created from a simple list, to which we can add some metadata:
[4]:
d1D = NDDataset(
    [10.0, 20.0, 30.0],
    name="Dataset N1",
    author="Blake and Mortimer",
    description="A dataset from scratch",
    history="creation",
)
d1D
[4]:
| name | Dataset N1 |
| author | Blake and Mortimer |
| created | 2025-02-18 09:41:13+00:00 |
| description | A dataset from scratch |
| history | 2025-02-18 09:41:13+00:00> Creation |
| DATA | |
| title | |
| values | [ 10 20 30] |
| size | 3 |
[5]:
print(d1D)
NDDataset: [float64] unitless (size: 3)
[6]:
_ = d1D.plot(figsize=(3, 2))
Except few additional metadata such author , created …, there is not much difference with respect to a conventional numpy.array. For example, one can apply numpy ufunc‘s directly to a NDDataset or make basic arithmetic operation with these objects:
[7]:
np.sqrt(d1D)
[7]:
| name | Dataset N1 |
| author | Blake and Mortimer |
| created | 2025-02-18 09:41:13+00:00 |
| description | A dataset from scratch |
| history | 2025-02-18 09:41:13+00:00> Creation 2025-02-18 09:41:13+00:00> Ufunc sqrt applied. |
| DATA | |
| title | sqrt( |
| values | [ 3.162 4.472 5.477] |
| size | 3 |
[8]:
d1D += d1D / 2.0
d1D
[8]:
| name | Dataset N1 |
| author | Blake and Mortimer |
| created | 2025-02-18 09:41:13+00:00 |
| description | A dataset from scratch |
| history | 2025-02-18 09:41:13+00:00> Creation 2025-02-18 09:41:13+00:00> Inplace binary op: iadd with `Dataset N1` |
| DATA | |
| title | |
| values | [ 15 30 45] |
| size | 3 |
As seen above, there are some attributes that are automatically added to the dataset:
id: This is a unique identifier for the object.name: A short and unique name for the dataset. It will beequal to the automaticidif it is not provided.author: Author determined from the computer name if not provided.created: Date and time of creation.modified: Date and time of modification.
These attributes can be modified by the user, but the id , created and modified attributes are read only.
Some other attributes are defined to describe the data:
title: A long name that will be used in plots or in some other operations.history: history of operation achieved on the object since the object creation.description: A comment or a description of the objects purpose or contents.origin: An optional reference to the source of the data.
Here is an example of the use of the NDDataset attributes:
[9]:
d1D.title = "intensity"
d1D.name = "mydataset"
d1D.history = "created from scratch"
d1D.description = "Some experimental measurements"
d1D
[9]:
| name | mydataset |
| author | Blake and Mortimer |
| created | 2025-02-18 09:41:13+00:00 |
| description | Some experimental measurements |
| history | 2025-02-18 09:41:13+00:00> Creation 2025-02-18 09:41:13+00:00> Inplace binary op: iadd with `Dataset N1` 2025-02-18 09:41:13+00:00> Created from scratch |
| DATA | |
| title | intensity |
| values | [ 15 30 45] |
| size | 3 |
d1D is a 1D (1-dimensional) dataset with only one dimension.
Some attributes are useful to check this kind of information:
[10]:
d1D.shape # the shape of 1D contain only one dimension size
[10]:
(3,)
[11]:
d1D.ndim # the number of dimensions
[11]:
1
[12]:
d1D.dims # the name of the dimension (it has been automatically attributed)
[12]:
['x']
Note: The names of the dimensions are set automatically. But they can be changed, with the limitation that the name must be a single letter.
[13]:
d1D.dims = ["q"] # change the list of dim names.
[14]:
d1D.dims
[14]:
['q']
nD-Dataset (multidimensional dataset)
To create a nD NDDataset, we can provide a nD-array like object to the NDDataset instance constructor
[15]:
a = np.random.rand(2, 4, 6)
a
[15]:
array([[[  0.8056,   0.6122, ...,  0.01105,   0.7779],
        [  0.5038,   0.2038, ...,   0.8108,   0.1725],
        [  0.8685,   0.8005, ...,   0.5094,   0.5353],
        [  0.5706,   0.7795, ...,    0.528,   0.8992]],

       [[  0.6837,   0.2052, ...,   0.3332,   0.3212],
        [  0.6007,   0.3464, ...,   0.4174,   0.6668],
        [  0.9336,   0.3075, ...,   0.7574,    0.393],
        [   0.524,   0.6204, ...,    0.713,   0.2387]]])
[16]:
d3D = NDDataset(a)
d3D.title = "energy"
d3D.author = "Someone"
d3D.name = "3D dataset creation"
d3D.history = "created from scratch"
d3D.description = "Some example"
d3D.dims = ["u", "v", "t"]
d3D
[16]:
| name | 3D dataset creation |
| author | Someone |
| created | 2025-02-18 09:41:13+00:00 |
| description | Some example |
| history | 2025-02-18 09:41:13+00:00> Created from scratch |
| DATA | |
| title | energy |
| values | [[[ 0.8056 0.6122 ... 0.01105 0.7779] [ 0.5038 0.2038 ... 0.8108 0.1725] [ 0.8685 0.8005 ... 0.5094 0.5353] [ 0.5706 0.7795 ... 0.528 0.8992]] [[ 0.6837 0.2052 ... 0.3332 0.3212] [ 0.6007 0.3464 ... 0.4174 0.6668] [ 0.9336 0.3075 ... 0.7574 0.393] [ 0.524 0.6204 ... 0.713 0.2387]]] |
| shape | (u:2, v:4, t:6) |
We can also add all information in a single statement
[17]:
d3D = NDDataset(
    a,
    dims=["u", "v", "t"],
    title="Energy",
    author="Someone",
    name="3D_dataset",
    history="created from scratch",
    description="a single statement creation example",
)
d3D
[17]:
| name | 3D_dataset |
| author | Someone |
| created | 2025-02-18 09:41:13+00:00 |
| description | a single statement creation example |
| history | 2025-02-18 09:41:13+00:00> Created from scratch |
| DATA | |
| title | Energy |
| values | [[[ 0.8056 0.6122 ... 0.01105 0.7779] [ 0.5038 0.2038 ... 0.8108 0.1725] [ 0.8685 0.8005 ... 0.5094 0.5353] [ 0.5706 0.7795 ... 0.528 0.8992]] [[ 0.6837 0.2052 ... 0.3332 0.3212] [ 0.6007 0.3464 ... 0.4174 0.6668] [ 0.9336 0.3075 ... 0.7574 0.393] [ 0.524 0.6204 ... 0.713 0.2387]]] |
| shape | (u:2, v:4, t:6) |
Three names are attributed at the creation (if they are not provided with the dims attribute, then the name are: ‘z’,’y’,’x’ automatically attributed)
[18]:
d3D.dims
[18]:
['u', 'v', 't']
[19]:
d3D.ndim
[19]:
3
[20]:
d3D.shape
[20]:
(2, 4, 6)
About the dates and times
The dates and times are stored internally as UTC (Coordinated_Universal_Time). Timezone information is stored in the timezone attribute. If not set, the default is to use the local timezone, which is probably the most common case.
[21]:
nd = NDDataset()
nd.created
[21]:
'2025-02-18 09:41:13+00:00'
In this case our local timezone has been used by default for the conversion from UTC datetime.
[22]:
nd.local_timezone
[22]:
'Etc/UTC'
[23]:
nd.timezone = "EST"
nd.created
[23]:
'2025-02-18 04:41:13-05:00'
For a list of timezone code (TZ) you can have a look at List_of_tz_database_time_zones.
About the history attribute
The history is saved internally into a list, but its has a different behaviour than the usual list. The first time a NDDataset is created, the list is empty
[24]:
nd = NDDataset()
nd.history
[24]:
[]
Assigning a string to the history attribute has two effects. The first one is that the string is appended automatically to the previous history list, and second it is preceeded by the time it has been added.
[25]:
nd.history = "some history"
nd.history = "another history to append"
nd.history = "..."
nd.history
[25]:
['2025-02-18 09:41:14+00:00> Some history',
 '2025-02-18 09:41:14+00:00> Another history to append',
 '2025-02-18 09:41:14+00:00> ...']
If you want to erase the history, assign an empty list
[26]:
nd.history = []
nd.history
[26]:
[]
If you want to replace the full history use bracket around your history line:
[27]:
nd.history = "Created form scratch"
nd.history = "a second ligne that will be erased"
nd.history = ["A more interesting message"]
nd.history
[27]:
['2025-02-18 09:41:14+00:00> A more interesting message']
Units
One interesting possibility for a NDDataset is to have defined units for the internal data.
[28]:
d1D.units = ur.eV # ur is a registry containing all available units
[29]:
d1D # note the eV symbol of the units added to the values field below
[29]:
| name | mydataset |
| author | Blake and Mortimer |
| created | 2025-02-18 09:41:13+00:00 |
| description | Some experimental measurements |
| history | 2025-02-18 09:41:13+00:00> Creation 2025-02-18 09:41:13+00:00> Inplace binary op: iadd with `Dataset N1` 2025-02-18 09:41:13+00:00> Created from scratch |
| DATA | |
| title | intensity |
| values | [ 15 30 45] eV |
| size | 3 |
This allows to make units-aware calculations:
[30]:
d1D**2 # note the results in eV^2
[30]:
| name | mydataset |
| author | Blake and Mortimer |
| created | 2025-02-18 09:41:13+00:00 |
| description | Some experimental measurements |
| history | 2025-02-18 09:41:13+00:00> Creation 2025-02-18 09:41:13+00:00> Inplace binary op: iadd with `Dataset N1` 2025-02-18 09:41:13+00:00> Created from scratch 2025-02-18 09:41:14+00:00> Binary operation pow with `2` has been performed |
| DATA | |
| title | intensity |
| values | [ 225 900 2025] eV² |
| size | 3 |
[31]:
np.sqrt(d1D) # note the result in e^0.5
[31]:
| name | mydataset |
| author | Blake and Mortimer |
| created | 2025-02-18 09:41:13+00:00 |
| description | Some experimental measurements |
| history | 2025-02-18 09:41:13+00:00> Creation 2025-02-18 09:41:13+00:00> Inplace binary op: iadd with `Dataset N1` 2025-02-18 09:41:13+00:00> Created from scratch 2025-02-18 09:41:14+00:00> Ufunc sqrt applied. |
| DATA | |
| title | sqrt(intensity) |
| values | [ 3.873 5.477 6.708] eV⁰⋅⁵ |
| size | 3 |
[32]:
time = 5.0 * ur.second
d1D / time  # here we get results in eV/s
[32]:
| name | mydataset |
| author | Blake and Mortimer |
| created | 2025-02-18 09:41:13+00:00 |
| description | Some experimental measurements |
| history | 2025-02-18 09:41:13+00:00> Creation 2025-02-18 09:41:13+00:00> Inplace binary op: iadd with `Dataset N1` 2025-02-18 09:41:13+00:00> Created from scratch 2025-02-18 09:41:14+00:00> Binary operation truediv with `5.0 s` has been performed |
| DATA | |
| title | intensity |
| values | [ 3 6 9] eV⋅s⁻¹ |
| size | 3 |
Conversion can be done between different units transparently
[33]:
d1D.to("J")
[33]:
| name | mydataset |
| author | Blake and Mortimer |
| created | 2025-02-18 09:41:13+00:00 |
| description | Some experimental measurements |
| history | 2025-02-18 09:41:13+00:00> Creation 2025-02-18 09:41:13+00:00> Inplace binary op: iadd with `Dataset N1` 2025-02-18 09:41:13+00:00> Created from scratch |
| DATA | |
| title | intensity |
| values | [2.403e-18 4.807e-18 7.21e-18] J |
| size | 3 |
[34]:
d1D.to("K")
[34]:
| name | mydataset |
| author | Blake and Mortimer |
| created | 2025-02-18 09:41:13+00:00 |
| description | Some experimental measurements |
| history | 2025-02-18 09:41:13+00:00> Creation 2025-02-18 09:41:13+00:00> Inplace binary op: iadd with `Dataset N1` 2025-02-18 09:41:13+00:00> Created from scratch |
| DATA | |
| title | intensity |
| values | [1.741e+05 3.481e+05 5.222e+05] K |
| size | 3 |
For more examples on how to use units with NDDataset, see the [gallery example](gettingstarted/examples/gallery/auto_examples_core/a_nddataset/plot_c_units.html
Coordinates
The above created d3D dataset has 3 dimensions, but no coordinate for these dimensions. Here arises a big difference with simple numpy-arrays:
We can add coordinates to each dimension of a NDDataset.
To get the list of all defined coordinates, we can use the coords attribute:
[35]:
d3D.coordset # no coordinates, so it returns nothing (None)
[36]:
d3D.t # the same for coordinate t, v, u which are not yet set
To add coordinates, on way is to set them one by one:
[37]:
d3D.t = (
    Coord.arange(6) * 0.1
)  # we need a sequence of 6 values for `t` dimension (see shape above)
d3D.t.title = "time"
d3D.t.units = ur.seconds
d3D.coordset  # now return a list of coordinates
[37]:
| DIMENSION `t` | |
| size | 6 |
| title | time |
| coordinates | [ 0 0.1 0.2 0.3 0.4 0.5] s |
[38]:
d3D.t
[38]:
| size | 6 |
| title | time |
| coordinates | [ 0 0.1 0.2 0.3 0.4 0.5] s |
[39]:
d3D.coordset("t") # Alternative way to get a given coordinates
[39]:
| size | 6 |
| title | time |
| coordinates | [ 0 0.1 0.2 0.3 0.4 0.5] s |
[40]:
d3D["t"] # another alternative way to get a given coordinates
[40]:
| size | 6 |
| title | time |
| coordinates | [ 0 0.1 0.2 0.3 0.4 0.5] s |
The two other coordinates u and v are still undefined
[41]:
d3D.u, d3D.v
[41]:
(Coord: empty, Coord: empty)
When the dataset is printed, only the information for the existing coordinates is given.
[42]:
d3D
[42]:
| name | 3D_dataset |
| author | Someone |
| created | 2025-02-18 09:41:13+00:00 |
| description | a single statement creation example |
| history | 2025-02-18 09:41:13+00:00> Created from scratch |
| DATA | |
| title | Energy |
| values | [[[ 0.8056 0.6122 ... 0.01105 0.7779] [ 0.5038 0.2038 ... 0.8108 0.1725] [ 0.8685 0.8005 ... 0.5094 0.5353] [ 0.5706 0.7795 ... 0.528 0.8992]] [[ 0.6837 0.2052 ... 0.3332 0.3212] [ 0.6007 0.3464 ... 0.4174 0.6668] [ 0.9336 0.3075 ... 0.7574 0.393] [ 0.524 0.6204 ... 0.713 0.2387]]] |
| shape | (u:2, v:4, t:6) |
| DIMENSION `t` | |
| size | 6 |
| title | time |
| coordinates | [ 0 0.1 0.2 0.3 0.4 0.5] s |
Programmatically, we can use the attribute is_empty or has_data to check this
[43]:
d3D.v.has_data, d3D.v.is_empty
[43]:
(False, True)
An error is raised when a coordinate doesn’t exist
[44]:
try:
    d3D.x
except KeyError as e:
    scp.error_(KeyError, e)
ERROR | KeyError: 'Could not find `x` in coordinates names or titles'
In some case it can also be useful to get a coordinate from its title instead of its name (the limitation is that if several coordinates have the same title, then only the first ones that is found in the coordinate list, will be returned - this can be ambiguous)
[45]:
d3D["time"]
[45]:
| size | 6 |
| title | time |
| coordinates | [ 0 0.1 0.2 0.3 0.4 0.5] s |
[46]:
d3D.time
[46]:
| size | 6 |
| title | time |
| coordinates | [ 0 0.1 0.2 0.3 0.4 0.5] s |
Labels
It is possible to use labels instead of numerical coordinates. They are sequence of objects .The length of the sequence must be equal to the size of a dimension.
The labels can be simple strings, e.g.,
[47]:
tags = list("ab")
d3D.u.title = "some tags"
d3D.u.labels = tags  # TODO: avoid repetition
d3D
[47]:
| name | 3D_dataset |
| author | Someone |
| created | 2025-02-18 09:41:13+00:00 |
| description | a single statement creation example |
| history | 2025-02-18 09:41:13+00:00> Created from scratch |
| DATA | |
| title | Energy |
| values | [[[ 0.8056 0.6122 ... 0.01105 0.7779] [ 0.5038 0.2038 ... 0.8108 0.1725] [ 0.8685 0.8005 ... 0.5094 0.5353] [ 0.5706 0.7795 ... 0.528 0.8992]] [[ 0.6837 0.2052 ... 0.3332 0.3212] [ 0.6007 0.3464 ... 0.4174 0.6668] [ 0.9336 0.3075 ... 0.7574 0.393] [ 0.524 0.6204 ... 0.713 0.2387]]] |
| shape | (u:2, v:4, t:6) |
| DIMENSION `t` | |
| size | 6 |
| title | time |
| coordinates | [ 0 0.1 0.2 0.3 0.4 0.5] s |
| DIMENSION `u` | |
| size | 2 |
| title | some tags |
| labels | [ a b] |
or more complex objects.
For instance here we use datetime.timedelta objects:
[48]:
from datetime import timedelta

start = timedelta(0)
times = [start + timedelta(seconds=x * 60) for x in range(6)]
d3D.t = None
d3D.t.labels = times
d3D.t.title = "time"
d3D
[48]:
| name | 3D_dataset |
| author | Someone |
| created | 2025-02-18 09:41:13+00:00 |
| description | a single statement creation example |
| history | 2025-02-18 09:41:13+00:00> Created from scratch |
| DATA | |
| title | Energy |
| values | [[[ 0.8056 0.6122 ... 0.01105 0.7779] [ 0.5038 0.2038 ... 0.8108 0.1725] [ 0.8685 0.8005 ... 0.5094 0.5353] [ 0.5706 0.7795 ... 0.528 0.8992]] [[ 0.6837 0.2052 ... 0.3332 0.3212] [ 0.6007 0.3464 ... 0.4174 0.6668] [ 0.9336 0.3075 ... 0.7574 0.393] [ 0.524 0.6204 ... 0.713 0.2387]]] |
| shape | (u:2, v:4, t:6) |
| DIMENSION `t` | |
| size | 6 |
| title | time |
| labels | [ 0:00:00 0:01:00 0:02:00 0:03:00 0:04:00 0:05:00] |
| DIMENSION `u` | |
| size | 2 |
| title | some tags |
| labels | [ a b] |
In this case, getting a coordinate that doesn’t possess numerical data but labels, will return the labels
[49]:
d3D.time
[49]:
| size | 6 |
| title | time |
| labels | [ 0:00:00 0:01:00 0:02:00 0:03:00 0:04:00 0:05:00] |
More insight on coordinates
Sharing coordinates between dimensions
Sometimes it is not necessary to have different coordinates for each axe. Some can be shared between axes.
For example, if we have a square matrix with the same coordinate in the two dimensions, the second dimension can refer to the first. Here we create a square 2D dataset, using the diag method:
[50]:
nd = NDDataset.diag((3, 3, 2.5))
nd
[50]:
| name | NDDataset_7e24a207 |
| author | runner@fv-az1670-365 |
| created | 2025-02-18 09:41:14+00:00 |
| history | 2025-02-18 09:41:14+00:00> Created using method : diag |
| DATA | |
| title | |
| values | [[ 3 0 0] [ 0 3 0] [ 0 0 2.5]] |
| shape | (y:3, x:3) |
and then we add the same coordinate for both dimensions
[51]:
coordx = Coord.arange(3)
nd.set_coordset(x=coordx, y="x")
nd
[51]:
| name | NDDataset_7e24a207 |
| author | runner@fv-az1670-365 |
| created | 2025-02-18 09:41:14+00:00 |
| history | 2025-02-18 09:41:14+00:00> Created using method : diag |
| DATA | |
| title | |
| values | [[ 3 0 0] [ 0 3 0] [ 0 0 2.5]] |
| shape | (y:3, x:3) |
| DIMENSION `x`=`y` | |
| size | 3 |
| title | |
| coordinates | [ 0 1 2] |
Setting coordinates using set_coordset
Let’s create 3 Coord objects to be used as coordinates for the 3 dimensions of the previous d3D dataset.
[52]:
d3D.dims = ["t", "v", "u"]
s0, s1, s2 = d3D.shape
coord0 = Coord.linspace(10.0, 100.0, s0, units="m", title="distance")
coord1 = Coord.linspace(20.0, 25.0, s1, units="K", title="temperature")
coord2 = Coord.linspace(0.0, 1000.0, s2, units="hour", title="elapsed time")
Syntax 1
[53]:
d3D.set_coordset(u=coord2, v=coord1, t=coord0)
d3D
[53]:
| name | 3D_dataset |
| author | Someone |
| created | 2025-02-18 09:41:13+00:00 |
| description | a single statement creation example |
| history | 2025-02-18 09:41:13+00:00> Created from scratch |
| DATA | |
| title | Energy |
| values | [[[ 0.8056 0.6122 ... 0.01105 0.7779] [ 0.5038 0.2038 ... 0.8108 0.1725] [ 0.8685 0.8005 ... 0.5094 0.5353] [ 0.5706 0.7795 ... 0.528 0.8992]] [[ 0.6837 0.2052 ... 0.3332 0.3212] [ 0.6007 0.3464 ... 0.4174 0.6668] [ 0.9336 0.3075 ... 0.7574 0.393] [ 0.524 0.6204 ... 0.713 0.2387]]] |
| shape | (t:2, v:4, u:6) |
| DIMENSION `t` | |
| size | 2 |
| title | distance |
| coordinates | [ 10 100] m |
| DIMENSION `u` | |
| size | 6 |
| title | elapsed time |
| coordinates | [ 0 200 400 600 800 1000] h |
| DIMENSION `v` | |
| size | 4 |
| title | temperature |
| coordinates | [ 20 21.67 23.33 25] K |
Syntax 2
[54]:
d3D.set_coordset({"u": coord2, "v": coord1, "t": coord0})
d3D
[54]:
| name | 3D_dataset |
| author | Someone |
| created | 2025-02-18 09:41:13+00:00 |
| description | a single statement creation example |
| history | 2025-02-18 09:41:13+00:00> Created from scratch |
| DATA | |
| title | Energy |
| values | [[[ 0.8056 0.6122 ... 0.01105 0.7779] [ 0.5038 0.2038 ... 0.8108 0.1725] [ 0.8685 0.8005 ... 0.5094 0.5353] [ 0.5706 0.7795 ... 0.528 0.8992]] [[ 0.6837 0.2052 ... 0.3332 0.3212] [ 0.6007 0.3464 ... 0.4174 0.6668] [ 0.9336 0.3075 ... 0.7574 0.393] [ 0.524 0.6204 ... 0.713 0.2387]]] |
| shape | (t:2, v:4, u:6) |
| DIMENSION `t` | |
| size | 2 |
| title | distance |
| coordinates | [ 10 100] m |
| DIMENSION `u` | |
| size | 6 |
| title | elapsed time |
| coordinates | [ 0 200 400 600 800 1000] h |
| DIMENSION `v` | |
| size | 4 |
| title | temperature |
| coordinates | [ 20 21.67 23.33 25] K |
Adding several coordinates to a single dimension
We can add several coordinates to the same dimension
[55]:
coord1b = Coord([1, 2, 3, 4], units="millitesla", title="magnetic field")
[56]:
d3D.set_coordset(u=coord2, v=[coord1, coord1b], t=coord0)
d3D
[56]:
| name | 3D_dataset |
| author | Someone |
| created | 2025-02-18 09:41:13+00:00 |
| description | a single statement creation example |
| history | 2025-02-18 09:41:13+00:00> Created from scratch |
| DATA | |
| title | Energy |
| values | [[[ 0.8056 0.6122 ... 0.01105 0.7779] [ 0.5038 0.2038 ... 0.8108 0.1725] [ 0.8685 0.8005 ... 0.5094 0.5353] [ 0.5706 0.7795 ... 0.528 0.8992]] [[ 0.6837 0.2052 ... 0.3332 0.3212] [ 0.6007 0.3464 ... 0.4174 0.6668] [ 0.9336 0.3075 ... 0.7574 0.393] [ 0.524 0.6204 ... 0.713 0.2387]]] |
| shape | (t:2, v:4, u:6) |
| DIMENSION `t` | |
| size | 2 |
| title | distance |
| coordinates | [ 10 100] m |
| DIMENSION `u` | |
| size | 6 |
| title | elapsed time |
| coordinates | [ 0 200 400 600 800 1000] h |
| DIMENSION `v` | |
| size | 4 |
| (_1) | |
| title | magnetic field |
| coordinates | [ 1 2 3 4] mT |
| (_2) | |
| title | temperature |
| coordinates | [ 20 21.67 23.33 25] K |
We can retrieve the various coordinates for a single dimension easily:
[57]:
d3D.v_1
[57]:
| size | 4 |
| title | magnetic field |
| coordinates | [ 1 2 3 4] mT |
Summary of the coordinate setting syntax
Some additional information about coordinate setting syntax
A. First syntax (probably the safer because the name of the dimension is specified, so this is less prone to errors!)
[58]:
d3D.set_coordset(u=coord2, v=[coord1, coord1b], t=coord0)
# or equivalent
d3D.set_coordset(u=coord2, v=CoordSet(coord1, coord1b), t=coord0)
d3D
[58]:
| name | 3D_dataset |
| author | Someone |
| created | 2025-02-18 09:41:13+00:00 |
| description | a single statement creation example |
| history | 2025-02-18 09:41:13+00:00> Created from scratch |
| DATA | |
| title | Energy |
| values | [[[ 0.8056 0.6122 ... 0.01105 0.7779] [ 0.5038 0.2038 ... 0.8108 0.1725] [ 0.8685 0.8005 ... 0.5094 0.5353] [ 0.5706 0.7795 ... 0.528 0.8992]] [[ 0.6837 0.2052 ... 0.3332 0.3212] [ 0.6007 0.3464 ... 0.4174 0.6668] [ 0.9336 0.3075 ... 0.7574 0.393] [ 0.524 0.6204 ... 0.713 0.2387]]] |
| shape | (t:2, v:4, u:6) |
| DIMENSION `t` | |
| size | 2 |
| title | distance |
| coordinates | [ 10 100] m |
| DIMENSION `u` | |
| size | 6 |
| title | elapsed time |
| coordinates | [ 0 200 400 600 800 1000] h |
| DIMENSION `v` | |
| size | 4 |
| (_1) | |
| title | magnetic field |
| coordinates | [ 1 2 3 4] mT |
| (_2) | |
| title | temperature |
| coordinates | [ 20 21.67 23.33 25] K |
B. Second syntax assuming the coordinates are given in the order of the dimensions.
Remember that we can check this order using the dims attribute of a NDDataset
[59]:
d3D.dims
[59]:
['t', 'v', 'u']
[60]:
d3D.set_coordset((coord0, [coord1, coord1b], coord2))
# or equivalent
d3D.set_coordset(coord0, CoordSet(coord1, coord1b), coord2)
d3D
[60]:
| name | 3D_dataset |
| author | Someone |
| created | 2025-02-18 09:41:13+00:00 |
| description | a single statement creation example |
| history | 2025-02-18 09:41:13+00:00> Created from scratch |
| DATA | |
| title | Energy |
| values | [[[ 0.8056 0.6122 ... 0.01105 0.7779] [ 0.5038 0.2038 ... 0.8108 0.1725] [ 0.8685 0.8005 ... 0.5094 0.5353] [ 0.5706 0.7795 ... 0.528 0.8992]] [[ 0.6837 0.2052 ... 0.3332 0.3212] [ 0.6007 0.3464 ... 0.4174 0.6668] [ 0.9336 0.3075 ... 0.7574 0.393] [ 0.524 0.6204 ... 0.713 0.2387]]] |
| shape | (t:2, v:4, u:6) |
| DIMENSION `t` | |
| size | 2 |
| title | distance |
| coordinates | [ 10 100] m |
| DIMENSION `u` | |
| size | 6 |
| title | elapsed time |
| coordinates | [ 0 200 400 600 800 1000] h |
| DIMENSION `v` | |
| size | 4 |
| (_1) | |
| title | magnetic field |
| coordinates | [ 1 2 3 4] mT |
| (_2) | |
| title | temperature |
| coordinates | [ 20 21.67 23.33 25] K |
C. Third syntax (from a dictionary)
[61]:
d3D.set_coordset({"t": coord0, "u": coord2, "v": [coord1, coord1b]})
d3D
[61]:
| name | 3D_dataset |
| author | Someone |
| created | 2025-02-18 09:41:13+00:00 |
| description | a single statement creation example |
| history | 2025-02-18 09:41:13+00:00> Created from scratch |
| DATA | |
| title | Energy |
| values | [[[ 0.8056 0.6122 ... 0.01105 0.7779] [ 0.5038 0.2038 ... 0.8108 0.1725] [ 0.8685 0.8005 ... 0.5094 0.5353] [ 0.5706 0.7795 ... 0.528 0.8992]] [[ 0.6837 0.2052 ... 0.3332 0.3212] [ 0.6007 0.3464 ... 0.4174 0.6668] [ 0.9336 0.3075 ... 0.7574 0.393] [ 0.524 0.6204 ... 0.713 0.2387]]] |
| shape | (t:2, v:4, u:6) |
| DIMENSION `t` | |
| size | 2 |
| title | distance |
| coordinates | [ 10 100] m |
| DIMENSION `u` | |
| size | 6 |
| title | elapsed time |
| coordinates | [ 0 200 400 600 800 1000] h |
| DIMENSION `v` | |
| size | 4 |
| (_1) | |
| title | magnetic field |
| coordinates | [ 1 2 3 4] mT |
| (_2) | |
| title | temperature |
| coordinates | [ 20 21.67 23.33 25] K |
D. It is also possible to use directly the CoordSet property
[62]:
d3D.coordset = coord0, [coord1, coord1b], coord2
d3D
[62]:
| name | 3D_dataset |
| author | Someone |
| created | 2025-02-18 09:41:13+00:00 |
| description | a single statement creation example |
| history | 2025-02-18 09:41:13+00:00> Created from scratch |
| DATA | |
| title | Energy |
| values | [[[ 0.8056 0.6122 ... 0.01105 0.7779] [ 0.5038 0.2038 ... 0.8108 0.1725] [ 0.8685 0.8005 ... 0.5094 0.5353] [ 0.5706 0.7795 ... 0.528 0.8992]] [[ 0.6837 0.2052 ... 0.3332 0.3212] [ 0.6007 0.3464 ... 0.4174 0.6668] [ 0.9336 0.3075 ... 0.7574 0.393] [ 0.524 0.6204 ... 0.713 0.2387]]] |
| shape | (t:2, v:4, u:6) |
| DIMENSION `t` | |
| size | 2 |
| title | distance |
| coordinates | [ 10 100] m |
| DIMENSION `u` | |
| size | 6 |
| title | elapsed time |
| coordinates | [ 0 200 400 600 800 1000] h |
| DIMENSION `v` | |
| size | 4 |
| (_1) | |
| title | temperature |
| coordinates | [ 20 21.67 23.33 25] K |
| (_2) | |
| title | magnetic field |
| coordinates | [ 1 2 3 4] mT |
[63]:
d3D.coordset = {"t": coord0, "u": coord2, "v": [coord1, coord1b]}
d3D
[63]:
| name | 3D_dataset |
| author | Someone |
| created | 2025-02-18 09:41:13+00:00 |
| description | a single statement creation example |
| history | 2025-02-18 09:41:13+00:00> Created from scratch |
| DATA | |
| title | Energy |
| values | [[[ 0.8056 0.6122 ... 0.01105 0.7779] [ 0.5038 0.2038 ... 0.8108 0.1725] [ 0.8685 0.8005 ... 0.5094 0.5353] [ 0.5706 0.7795 ... 0.528 0.8992]] [[ 0.6837 0.2052 ... 0.3332 0.3212] [ 0.6007 0.3464 ... 0.4174 0.6668] [ 0.9336 0.3075 ... 0.7574 0.393] [ 0.524 0.6204 ... 0.713 0.2387]]] |
| shape | (t:2, v:4, u:6) |
| DIMENSION `t` | |
| size | 2 |
| title | distance |
| coordinates | [ 10 100] m |
| DIMENSION `u` | |
| size | 6 |
| title | elapsed time |
| coordinates | [ 0 200 400 600 800 1000] h |
| DIMENSION `v` | |
| size | 4 |
| (_1) | |
| title | magnetic field |
| coordinates | [ 1 2 3 4] mT |
| (_2) | |
| title | temperature |
| coordinates | [ 20 21.67 23.33 25] K |
[64]:
d3D.coordset = CoordSet(t=coord0, u=coord2, v=[coord1, coord1b])
d3D
[64]:
| name | 3D_dataset |
| author | Someone |
| created | 2025-02-18 09:41:13+00:00 |
| description | a single statement creation example |
| history | 2025-02-18 09:41:13+00:00> Created from scratch |
| DATA | |
| title | Energy |
| values | [[[ 0.8056 0.6122 ... 0.01105 0.7779] [ 0.5038 0.2038 ... 0.8108 0.1725] [ 0.8685 0.8005 ... 0.5094 0.5353] [ 0.5706 0.7795 ... 0.528 0.8992]] [[ 0.6837 0.2052 ... 0.3332 0.3212] [ 0.6007 0.3464 ... 0.4174 0.6668] [ 0.9336 0.3075 ... 0.7574 0.393] [ 0.524 0.6204 ... 0.713 0.2387]]] |
| shape | (t:2, v:4, u:6) |
| DIMENSION `t` | |
| size | 2 |
| title | distance |
| coordinates | [ 10 100] m |
| DIMENSION `u` | |
| size | 6 |
| title | elapsed time |
| coordinates | [ 0 200 400 600 800 1000] h |
| DIMENSION `v` | |
| size | 4 |
| (_1) | |
| title | magnetic field |
| coordinates | [ 1 2 3 4] mT |
| (_2) | |
| title | temperature |
| coordinates | [ 20 21.67 23.33 25] K |
WARNING
Do not use list for setting multiples coordinates! use tuples
This raise an error (list have another signification: it’s used to set a “same dim” CoordSet see example A or B)
[65]:
try:
    d3D.coordset = [coord0, coord1, coord2]
except ValueError:
    scp.error_(
        ValueError,
        "Coordinates must be of the same size for a dimension with multiple coordinates",
    )
ERROR | ValueError: Coordinates must be of the same size for a dimension with multiple coordinates
This works : it uses a tuple () , not a list []
[66]:
d3D.coordset = (
    coord0,
    coord1,
    coord2,
)  # equivalent to d3D.coordset = coord0, coord1, coord2
d3D
[66]:
| name | 3D_dataset |
| author | Someone |
| created | 2025-02-18 09:41:13+00:00 |
| description | a single statement creation example |
| history | 2025-02-18 09:41:13+00:00> Created from scratch |
| DATA | |
| title | Energy |
| values | [[[ 0.8056 0.6122 ... 0.01105 0.7779] [ 0.5038 0.2038 ... 0.8108 0.1725] [ 0.8685 0.8005 ... 0.5094 0.5353] [ 0.5706 0.7795 ... 0.528 0.8992]] [[ 0.6837 0.2052 ... 0.3332 0.3212] [ 0.6007 0.3464 ... 0.4174 0.6668] [ 0.9336 0.3075 ... 0.7574 0.393] [ 0.524 0.6204 ... 0.713 0.2387]]] |
| shape | (t:2, v:4, u:6) |
| DIMENSION `t` | |
| size | 2 |
| title | distance |
| coordinates | [ 10 100] m |
| DIMENSION `u` | |
| size | 6 |
| title | elapsed time |
| coordinates | [ 0 200 400 600 800 1000] h |
| DIMENSION `v` | |
| size | 4 |
| title | temperature |
| coordinates | [ 20 21.67 23.33 25] K |
E. Setting the coordinates individually
Either a single coordinate
[67]:
d3D.u = coord2
d3D
[67]:
| name | 3D_dataset |
| author | Someone |
| created | 2025-02-18 09:41:13+00:00 |
| description | a single statement creation example |
| history | 2025-02-18 09:41:13+00:00> Created from scratch |
| DATA | |
| title | Energy |
| values | [[[ 0.8056 0.6122 ... 0.01105 0.7779] [ 0.5038 0.2038 ... 0.8108 0.1725] [ 0.8685 0.8005 ... 0.5094 0.5353] [ 0.5706 0.7795 ... 0.528 0.8992]] [[ 0.6837 0.2052 ... 0.3332 0.3212] [ 0.6007 0.3464 ... 0.4174 0.6668] [ 0.9336 0.3075 ... 0.7574 0.393] [ 0.524 0.6204 ... 0.713 0.2387]]] |
| shape | (t:2, v:4, u:6) |
| DIMENSION `t` | |
| size | 2 |
| title | distance |
| coordinates | [ 10 100] m |
| DIMENSION `u` | |
| size | 6 |
| title | elapsed time |
| coordinates | [ 0 200 400 600 800 1000] h |
| DIMENSION `v` | |
| size | 4 |
| title | temperature |
| coordinates | [ 20 21.67 23.33 25] K |
or multiple coordinates for a single dimension
[68]:
d3D.v = [coord1, coord1b]
d3D
[68]:
| name | 3D_dataset |
| author | Someone |
| created | 2025-02-18 09:41:13+00:00 |
| description | a single statement creation example |
| history | 2025-02-18 09:41:13+00:00> Created from scratch |
| DATA | |
| title | Energy |
| values | [[[ 0.8056 0.6122 ... 0.01105 0.7779] [ 0.5038 0.2038 ... 0.8108 0.1725] [ 0.8685 0.8005 ... 0.5094 0.5353] [ 0.5706 0.7795 ... 0.528 0.8992]] [[ 0.6837 0.2052 ... 0.3332 0.3212] [ 0.6007 0.3464 ... 0.4174 0.6668] [ 0.9336 0.3075 ... 0.7574 0.393] [ 0.524 0.6204 ... 0.713 0.2387]]] |
| shape | (t:2, v:4, u:6) |
| DIMENSION `t` | |
| size | 2 |
| title | distance |
| coordinates | [ 10 100] m |
| DIMENSION `u` | |
| size | 6 |
| title | elapsed time |
| coordinates | [ 0 200 400 600 800 1000] h |
| DIMENSION `v` | |
| size | 4 |
| (_1) | |
| title | temperature |
| coordinates | [ 20 21.67 23.33 25] K |
| (_2) | |
| title | magnetic field |
| coordinates | [ 1 2 3 4] mT |
or using a CoordSet object.
[69]:
d3D.v = CoordSet(coord1, coord1b)
d3D
[69]:
| name | 3D_dataset |
| author | Someone |
| created | 2025-02-18 09:41:13+00:00 |
| description | a single statement creation example |
| history | 2025-02-18 09:41:13+00:00> Created from scratch |
| DATA | |
| title | Energy |
| values | [[[ 0.8056 0.6122 ... 0.01105 0.7779] [ 0.5038 0.2038 ... 0.8108 0.1725] [ 0.8685 0.8005 ... 0.5094 0.5353] [ 0.5706 0.7795 ... 0.528 0.8992]] [[ 0.6837 0.2052 ... 0.3332 0.3212] [ 0.6007 0.3464 ... 0.4174 0.6668] [ 0.9336 0.3075 ... 0.7574 0.393] [ 0.524 0.6204 ... 0.713 0.2387]]] |
| shape | (t:2, v:4, u:6) |
| DIMENSION `t` | |
| size | 2 |
| title | distance |
| coordinates | [ 10 100] m |
| DIMENSION `u` | |
| size | 6 |
| title | elapsed time |
| coordinates | [ 0 200 400 600 800 1000] h |
| DIMENSION `v` | |
| size | 4 |
| (_1) | |
| title | magnetic field |
| coordinates | [ 1 2 3 4] mT |
| (_2) | |
| title | temperature |
| coordinates | [ 20 21.67 23.33 25] K |
Methods to create NDDataset
There are many ways to create NDDataset objects.
Let’s first create 2 coordinate objects, for which we can define labels and units! Note the use of the function linspaceto generate the data.
[70]:
c0 = Coord.linspace(
    start=4000.0, stop=1000.0, num=5, labels=None, units="cm^-1", title="wavenumber"
)
[71]:
c1 = Coord.linspace(
    10.0, 40.0, 3, labels=["Cold", "RT", "Hot"], units="K", title="temperature"
)
The full coordset will be the following
[72]:
cs = CoordSet(c0, c1)
cs
[72]:
| DIMENSION `x` | |
| size | 3 |
| title | temperature |
| coordinates | [ 10 25 40] K |
| labels | [ Cold RT Hot] |
| DIMENSION `y` | |
| size | 5 |
| title | wavenumber |
| coordinates | [ 4000 3250 2500 1750 1000] cm⁻¹ |
Now we will generate the full dataset, using a fromfunction method. All needed information are passed as parameter of the NDDataset instance constructor.
Create a dataset from a function
[73]:
def func(x, y, extra):
    return x * y / extra
[74]:
ds = NDDataset.fromfunction(
    func,
    extra=100 * ur.cm**-1,  # extra arguments passed to the function
    coordset=cs,
    name="mydataset",
    title="absorbance",
    units=None,
)  # when None, units will be determined from the function results

ds.description = """Dataset example created for this tutorial.
It's a 2-D dataset"""

ds.author = "Blake & Mortimer"
ds
[74]:
| name | mydataset |
| author | Blake & Mortimer |
| created | 2025-02-18 09:41:14+00:00 |
| description | Dataset example created for this tutorial. It's a 2-D dataset |
| history | 2025-02-18 09:41:14+00:00> Created using method : fromfunction |
| DATA | |
| title | absorbance |
| values | [[ 400 1000 1600] [ 325 812.5 1300] ... [ 175 437.5 700] [ 100 250 400]] K |
| shape | (y:5, x:3) |
| DIMENSION `x` | |
| size | 3 |
| title | temperature |
| coordinates | [ 10 25 40] K |
| labels | [ Cold RT Hot] |
| DIMENSION `y` | |
| size | 5 |
| title | wavenumber |
| coordinates | [ 4000 3250 2500 1750 1000] cm⁻¹ |
Using numpy-like constructors of NDDatasets
[75]:
dz = NDDataset.zeros(
    (5, 3), coordset=cs, units="meters", title="Datasets with only zeros"
)
[76]:
do = NDDataset.ones(
    (5, 3), coordset=cs, units="kilograms", title="Datasets with only ones"
)
[77]:
df = NDDataset.full(
    (5, 3), fill_value=1.25, coordset=cs, units="radians", title="with only float=1.25"
)
df
[77]:
| name | NDDataset_7e918aa1 |
| author | runner@fv-az1670-365 |
| created | 2025-02-18 09:41:14+00:00 |
| history | 2025-02-18 09:41:14+00:00> Created using method : full |
| DATA | |
| title | with only float=1.25 |
| values | [[ 1.25 1.25 1.25] [ 1.25 1.25 1.25] ... [ 1.25 1.25 1.25] [ 1.25 1.25 1.25]] rad |
| shape | (y:5, x:3) |
| DIMENSION `x` | |
| size | 3 |
| title | temperature |
| coordinates | [ 10 25 40] K |
| labels | [ Cold RT Hot] |
| DIMENSION `y` | |
| size | 5 |
| title | wavenumber |
| coordinates | [ 4000 3250 2500 1750 1000] cm⁻¹ |
As with numpy, it is also possible to take another dataset as a template:
[78]:
df = NDDataset.full_like(d3D, dtype="int", fill_value=2)
df
[78]:
| name | 3D_dataset |
| author | runner@fv-az1670-365 |
| created | 2025-02-18 09:41:14+00:00 |
| history | 2025-02-18 09:41:13+00:00> Created from scratch 2025-02-18 09:41:14+00:00> Created using method : full_like |
| DATA | |
| title | Energy |
| values | [[[ 2 2 ... 2 2] [ 2 2 ... 2 2] [ 2 2 ... 2 2] [ 2 2 ... 2 2]] [[ 2 2 ... 2 2] [ 2 2 ... 2 2] [ 2 2 ... 2 2] [ 2 2 ... 2 2]]] |
| shape | (t:2, v:4, u:6) |
| DIMENSION `t` | |
| size | 2 |
| title | distance |
| coordinates | [ 10 100] m |
| DIMENSION `u` | |
| size | 6 |
| title | elapsed time |
| coordinates | [ 0 200 400 600 800 1000] h |
| DIMENSION `v` | |
| size | 4 |
| (_1) | |
| title | magnetic field |
| coordinates | [ 1 2 3 4] mT |
| (_2) | |
| title | temperature |
| coordinates | [ 20 21.67 23.33 25] K |
[79]:
nd = NDDataset.diag((3, 3, 2.5))
nd
[79]:
| name | NDDataset_7e918ac5 |
| author | runner@fv-az1670-365 |
| created | 2025-02-18 09:41:14+00:00 |
| history | 2025-02-18 09:41:14+00:00> Created using method : diag |
| DATA | |
| title | |
| values | [[ 3 0 0] [ 0 3 0] [ 0 0 2.5]] |
| shape | (y:3, x:3) |
Copying existing NDDataset
To copy an existing dataset, this is as simple as:
[80]:
d3D_copy = d3D.copy()
or alternatively:
[81]:
d3D_copy = d3D[:]
Finally, it is also possible to initialize a dataset using an existing one:
[82]:
d3Dduplicate = NDDataset(d3D, name=f"duplicate of {d3D.name}", units="absorbance")
d3Dduplicate
[82]:
| name | duplicate of 3D_dataset |
| author | runner@fv-az1670-365 |
| created | 2025-02-18 09:41:14+00:00 |
| history | 2025-02-18 09:41:13+00:00> Created from scratch |
| DATA | |
| title | Energy |
| values | [[[ 0.8056 0.6122 ... 0.01105 0.7779] [ 0.5038 0.2038 ... 0.8108 0.1725] [ 0.8685 0.8005 ... 0.5094 0.5353] [ 0.5706 0.7795 ... 0.528 0.8992]] [[ 0.6837 0.2052 ... 0.3332 0.3212] [ 0.6007 0.3464 ... 0.4174 0.6668] [ 0.9336 0.3075 ... 0.7574 0.393] [ 0.524 0.6204 ... 0.713 0.2387]]] a.u. |
| shape | (t:2, v:4, u:6) |
| DIMENSION `t` | |
| size | 2 |
| title | distance |
| coordinates | [ 10 100] m |
| DIMENSION `u` | |
| size | 6 |
| title | elapsed time |
| coordinates | [ 0 200 400 600 800 1000] h |
| DIMENSION `v` | |
| size | 4 |
| (_1) | |
| title | magnetic field |
| coordinates | [ 1 2 3 4] mT |
| (_2) | |
| title | temperature |
| coordinates | [ 20 21.67 23.33 25] K |
Importing from external dataset
NDDataset can be created from the importation of external data
A test’s data folder contains some data for experimenting some features of datasets.
[83]:
# let check if this directory exists and display its actual content:
datadir = scp.preferences.datadir
if datadir.exists():
    print(datadir.name)
testdata
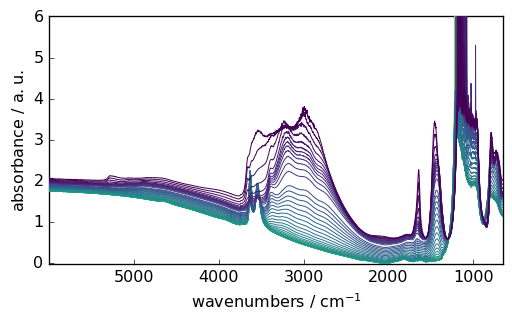
Let’s load grouped IR spectra acquired using OMNIC:
[84]:
nd = NDDataset.read_omnic(datadir / "irdata/nh4y-activation.spg")
nd.preferences.reset()
_ = nd.plot()
Even if we do not specify the datadir, the application first look in the directory by default.
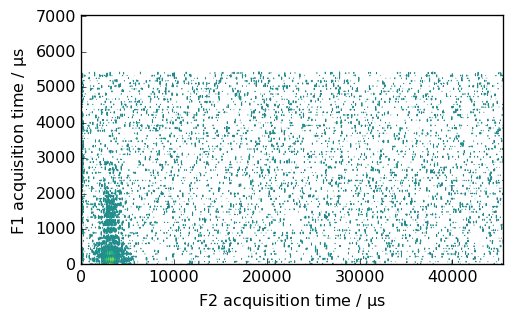
Now, lets load a NMR dataset (in the Bruker format).
[85]:
path = datadir / "nmrdata" / "bruker" / "tests" / "nmr" / "topspin_2d"

# load the data directly (no need to create the dataset first)
nd2 = NDDataset.read_topspin(path, expno=1, remove_digital_filter=True)

# view it...
nd2.x.to("s")
nd2.y.to("ms")

ax = nd2.plot(method="map")
WARNING | (UserWarning) (196608,)cannot be shaped into(147, 1024)