spectrochempy.plot_compare
- plot_compare(X, X_ref, *, ax=None, clear=True, residual=True, title=None, show_yaxis=True, show=True, exp_c=None, calc_c=None, resid_c=None, exp_linestyle='-', calc_linestyle='--', resid_linestyle='-', exp_linewidth=1.0, calc_linewidth=1.6, resid_linewidth=1.0, exp_label=None, calc_label=None, resid_label='difference', legend_loc='best', kind=None, method=None, offset=None, nb_traces='all', **kwargs)[source]
Compare two datasets (X vs X_ref) with optional residual.
- Parameters:
X (NDDataset) – Experimental dataset.
X_ref (NDDataset) – Reference or reconstructed dataset to compare with
X.ax (matplotlib.axes.Axes, optional) – Axes to reuse. A new axes is created when omitted.
clear (bool, default=True) – Clear a supplied axes before plotting.
residual (bool, default=True) – Plot the difference
X - X_ref.title (str, optional) – Axes title.
show_yaxis (bool, default=True) – Display the y-axis.
show (bool, default=True) – Perform SpectroChemPy’s explicit display step after plotting.
exp_c, calc_c, resid_c (color, optional) – Colors of the experimental, comparison, and residual traces.
exp_linestyle, calc_linestyle, resid_linestyle (str, optional) – Line styles of the experimental, comparison, and residual traces.
exp_linewidth, calc_linewidth, resid_linewidth (float, optional) – Line widths of the experimental, comparison, and residual traces.
exp_label, calc_label, resid_label (str, optional) – Legend labels for the experimental, comparison, and residual traces.
legend_loc (str, default=”best”) – Matplotlib legend location.
kind, method ({“line”, “scatter”}, optional) – Plot geometry.
kindtakes precedence over the compatibility aliasmethod.offset (float, optional) – Residual offset as a percentage of the joint signal range.
nb_traces (int or “all”, default=”all”) – Number of evenly spaced traces to display from 2D datasets.
**kwargs – Additional rendering options passed to the line renderer.
- Returns:
matplotlib.axes.Axes – Axes containing the comparison plot.
Examples using spectrochempy.plot_compare
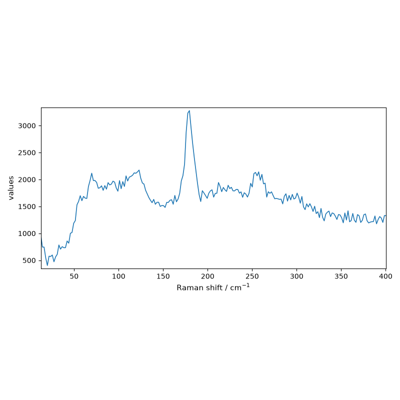
Compare smoothing window sizes on a Raman spectrum