Note
Go to the end to download the full example code.
IRIS: 2D-IRIS analysis (plugin)
This example introduces 2D-IRIS analysis of CO adsorption on a sulfide catalyst
with the optional spectrochempy-iris plugin.
Requires the official spectrochempy-iris plugin.
Install with: pip install spectrochempy[iris].
import spectrochempy as scp
Loading and coordinating the dataset
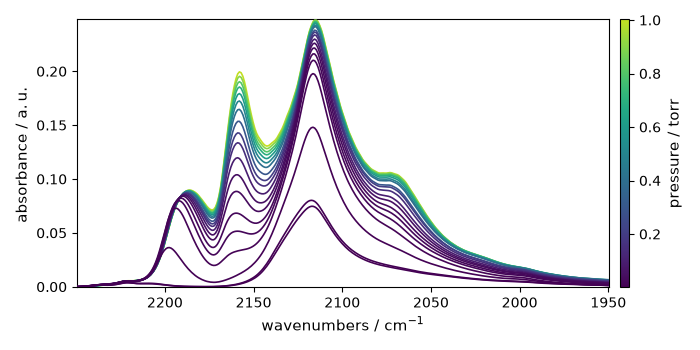
The example data contain infrared spectra recorded during CO adsorption. The
dataset has wavenumber coordinates along x and acquisition timestamps along
y.
X = scp.read_omnic("irdata/CO@Mo_Al2O3.SPG")
X.coordset
The IRIS model is easier to interpret with pressure coordinates along the
observation axis, so we attach the measured CO pressures to y.
pressures = [
    0.003,
    0.004,
    0.009,
    0.014,
    0.021,
    0.026,
    0.036,
    0.051,
    0.093,
    0.150,
    0.203,
    0.300,
    0.404,
    0.503,
    0.602,
    0.702,
    0.801,
    0.905,
    1.004,
]
c_pressures = scp.Coord(pressures, title="pressure", units="torr")
Keep the original time coordinate as a secondary coordinate, and make pressure the active one for plotting and IRIS fitting.
c_times = X.y.copy()
X.y = [c_times, c_pressures]
X.y.select(2)
X.coordset
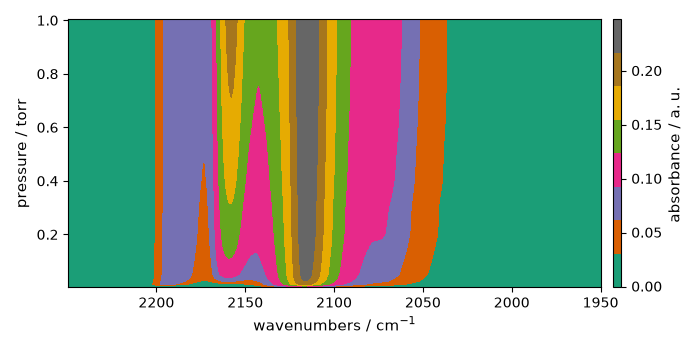
We now select the CO adsorption spectral region.
IRIS analysis without regularization
The plugin exposes its workflows through scp.iris and also adds
dataset-bound helpers under dataset.iris. We start by building the
Langmuir kernel from the dataset accessor.
K = X_.iris.kernel_matrix(kernel_type="langmuir", q=[-8, -1, 50])
K.kernel
The model can then be fitted with no explicit regularization.
iris1 = scp.iris.IRIS(log_level="INFO")
_ = iris1.fit(X_, K)
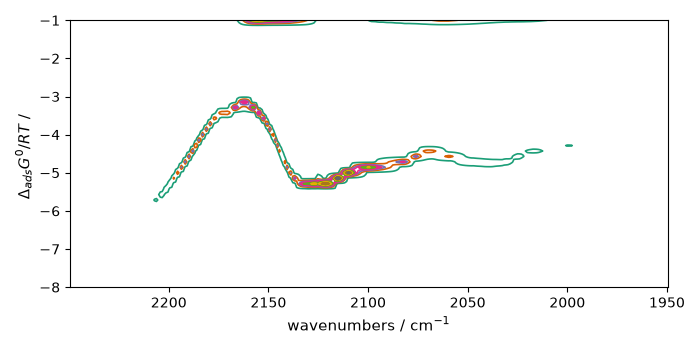
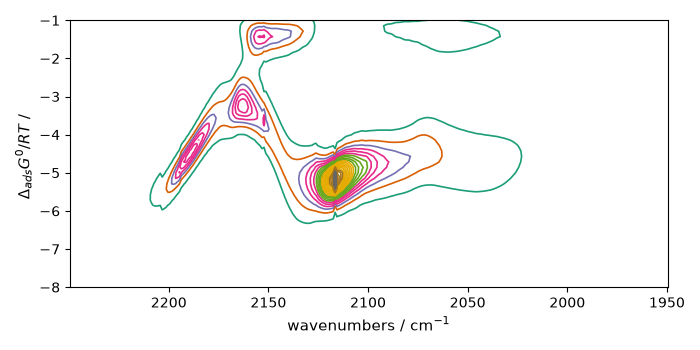
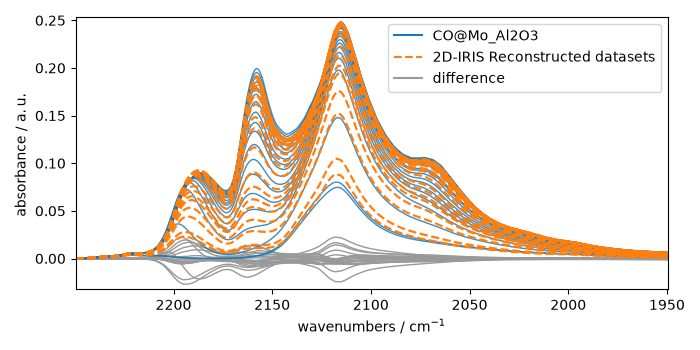
Grouped fitted outputs are available from result. Historical direct
attributes such as f remain supported, but the grouped result is the
preferred way to inspect the fit.
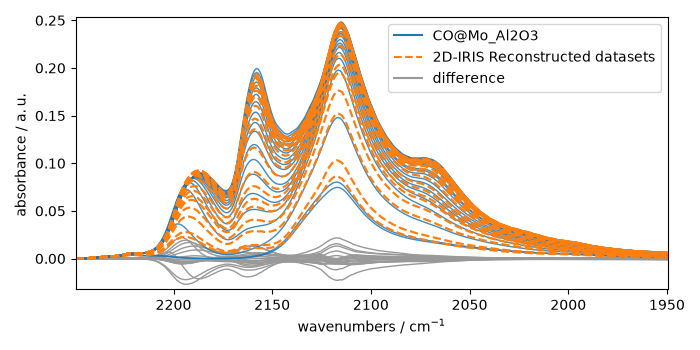
/home/runner/work/spectrochempy/spectrochempy/src/spectrochempy/utils/decorators.py:185: DeprecationWarning: The `DecompositionAnalysis.plotmerit` method is now deprecated. Use `plot_merit` instead. It will not be removed before the SpectroChemPy deprecation policy is satisfied.
  warn_deprecated(
Manual regularization search
A second fit scans a regularization range manually and displays the L-curve.
iris2 = scp.iris.IRIS(reg_par=[-10, 1, 12])
_ = iris2.fit(X_, K)
_ = iris2.plotlcurve(title="L curve, manual search")
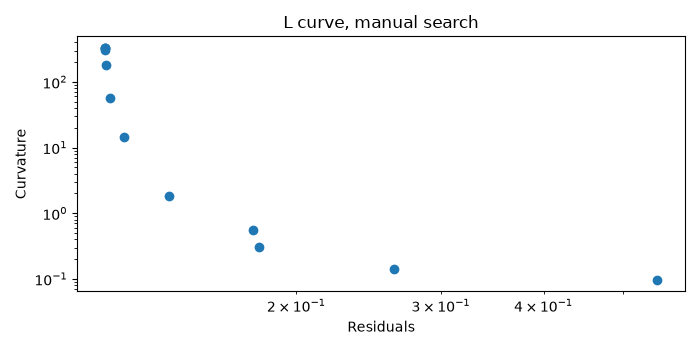
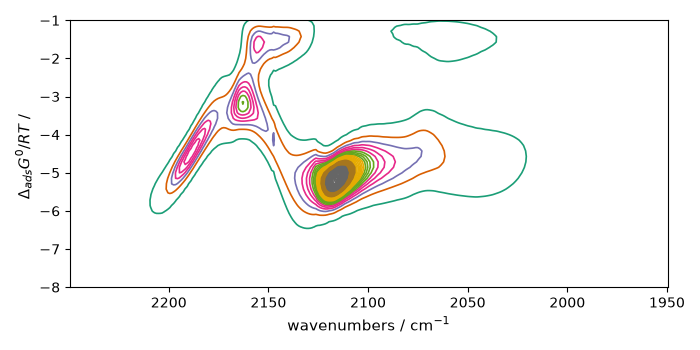
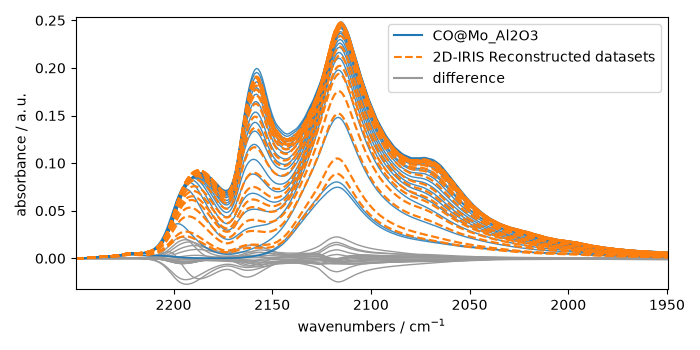
The best regularization parameter is visually near index -6 for this
dataset, corresponding to a lambda around 1e-4.
/home/runner/work/spectrochempy/spectrochempy/src/spectrochempy/utils/decorators.py:185: DeprecationWarning: The `DecompositionAnalysis.plotmerit` method is now deprecated. Use `plot_merit` instead. It will not be removed before the SpectroChemPy deprecation policy is satisfied.
  warn_deprecated(
Automatic search
We can then refine the search around the visually selected range.
iris3 = scp.iris.IRIS(log_level="INFO", reg_par=[-6, -2])
_ = iris3.fit(X_, K)
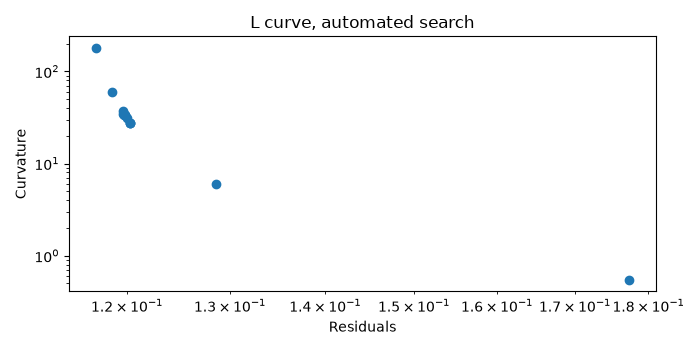
_ = iris3.plotlcurve(title="L curve, automated search")
Build S matrix (sharpness)
... done
Solving for 312 channel(s) and 19 observations, search optimum regularization parameter in the range: [10**-6, 10**-2]
Initial Log(lambda) values = [      -6   -4.472   -3.528       -2]
log10(lambda)=-6.000 -->  residuals = 1.171e-01    regularization constraint  = 1.796e+02
log10(lambda)=-4.472 -->  residuals = 1.203e-01    regularization constraint  = 2.751e+01
log10(lambda)=-3.528 -->  residuals = 1.286e-01    regularization constraint  = 5.986e+00
log10(lambda)=-2.000 -->  residuals = 1.773e-01    regularization constraint  = 5.488e-01
Curvatures of the inner points: C1 = 0.040 ; C2 = 0.105
New range of Log(lambda) values: [      -6   -5.056   -4.472   -3.528]
log10(lambda)=-5.056 -->  residuals = 1.186e-01    regularization constraint  = 6.040e+01
new curvature: C2 = 0.051
New range (Log lambda):[  -5.056   -4.472   -4.111   -3.528]
log10(lambda)=-4.111 -->  residuals = 1.223e-01    regularization constraint  = 1.687e+01
Curvatures of the inner points: C1 = 0.054 ; C2 = 0.047
New range of Log(lambda) values: [  -5.056   -4.695   -4.472   -4.111]
log10(lambda)=-4.695 -->  residuals = 1.197e-01    regularization constraint  = 3.702e+01
new curvature: C2 = 0.091
New range (Log lambda):[  -4.695   -4.472   -4.334   -4.111]
log10(lambda)=-4.334 -->  residuals = 1.207e-01    regularization constraint  = 2.273e+01
Curvatures of the inner points: C1 = -0.020 ; C2 = 0.272
New range of Log(lambda) values: [  -4.695   -4.557   -4.472   -4.334]
log10(lambda)=-4.557 -->  residuals = 1.200e-01    regularization constraint  = 3.087e+01
new curvature: C2 = -0.042
New range of Log(lambda) values: [  -4.695    -4.61   -4.557   -4.472]
log10(lambda)=-4.610 -->  residuals = 1.198e-01    regularization constraint  = 3.330e+01
new curvature: C2 = -0.275
New range of Log(lambda) values: [  -4.695   -4.642    -4.61   -4.557]
log10(lambda)=-4.642 -->  residuals = 1.197e-01    regularization constraint  = 3.480e+01
new curvature: C2 = 0.234
New range (Log lambda):[  -4.642    -4.61    -4.59   -4.557]
log10(lambda)=-4.590 -->  residuals = 1.199e-01    regularization constraint  = 3.241e+01
Curvatures of the inner points: C1 = 0.092 ; C2 = 0.440
New range of Log(lambda) values: [  -4.642   -4.622    -4.61    -4.59]
log10(lambda)=-4.622 -->  residuals = 1.197e-01    regularization constraint  = 3.386e+01
new curvature: C2 = 0.083
New range (Log lambda): [  -4.642    -4.63   -4.622    -4.61]
log10(lambda)=-4.630 -->  residuals = 1.197e-01    regularization constraint  = 3.422e+01
 optimum found: index = 5 ; Log(lambda) = -4.622 ; lambda = 2.38602e-05 ; curvature = 0.092
Done.
The largest curvature of the L-curve is at index 5 for this automated search.
 equal_aspect=True ignored: X and Y units are incompatible or missing.
/home/runner/work/spectrochempy/spectrochempy/src/spectrochempy/utils/decorators.py:185: DeprecationWarning: The `DecompositionAnalysis.plotmerit` method is now deprecated. Use `plot_merit` instead. It will not be removed before the SpectroChemPy deprecation policy is satisfied.
  warn_deprecated(
The historical root example also demonstrated the legacy direct classes
IRIS and IrisKernel. New gallery material should prefer the plugin
namespace shown above: scp.iris.IRIS and dataset.iris.kernel_matrix.
# Uncomment the following line to display all figures when running the script
# directly with Python.
#
# scp.show()
Total running time of the script: (0 minutes 11.789 seconds)