spectrochempy.MCRALS.plotmerit
- MCRALS.plotmerit(**kwargs)[source]
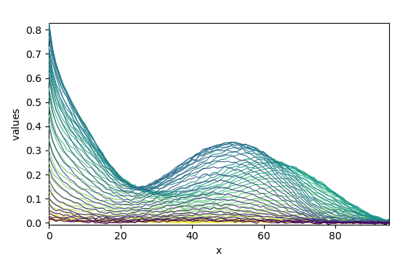
Plots the input dataset, reconstructed dataset and residuals.
- Parameters
**kwargs – optional “colors” argument: tuple or array of 3 colors for \(X\), \(\hat X\) and \(E\).
- Returns
ax – subplot.
Examples using spectrochempy.MCRALS.plotmerit
MCR-ALS optimization example (original example from Jaumot)
MCR-ALS optimization example (original example from Jaumot)