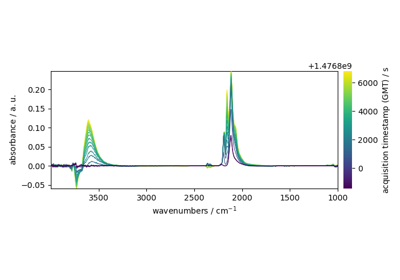
spectrochempy.IRIS.plotlcurve
- IRIS.plotlcurve(scale='ll', title='L curve')[source]
Plot the L Curve.
- Parameters
scale (str, optional, default=’ll’) – String of 2 letters among ‘l’ (log) or ‘n’ (non-log) indicating whether the y and x axes should be log scales.
title (str, optional, default=’L curve’) – Plot title.
- Returns
matplotlib.pyplot.axes – The axes.
