spectrochempy.IRIS.plotmerit
- IRIS.plotmerit(index=None, **kwargs)[source]
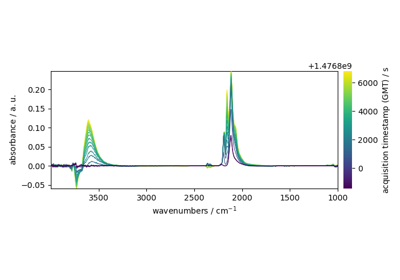
Plot the input dataset, reconstructed dataset and residuals.
- Parameters
index (int, list or tuple of int, optional, default: None) – Index(es) of the inversions (i.e. of the lambda values) to consider. If ‘None’: plots for all indices.
**kwargs – Keywords arguments passed to the plot() function.
- Returns
list of axes – The axes.