Note
Go to the end to download the full example code
EFA analysis example
In this example, we perform the Evolving Factor Analysis
sphinx_gallery_thumbnail_number = 2
import os
import spectrochempy as scp
Upload and preprocess a dataset
datadir = scp.preferences.datadir
dataset = scp.read_omnic(os.path.join(datadir, "irdata", "nh4y-activation.spg"))
columns masking
difference spectra
dataset -= dataset[-1]
dataset.plot_stack()
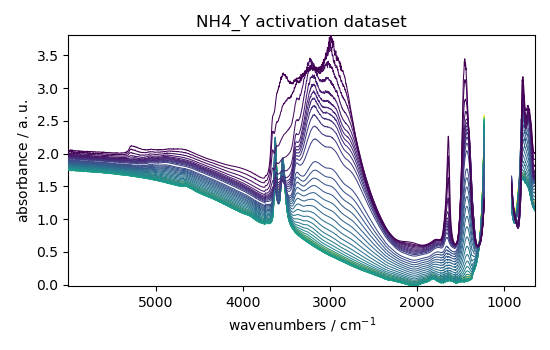
<_Axes: xlabel='wavenumbers $\\mathrm{/\\ \\mathrm{cm}^{-1}}$', ylabel='absorbance $\\mathrm{/\\ \\mathrm{a.u.}}$'>
column masking for bad columns
dataset[10:12] = scp.MASKED
Evolving Factor Analysis
Show results
npc = 4
c = efa.get_conc(npc)
c.T.plot()

# scp.show()  # Uncomment to show plot if needed (not necessary in jupyter notebook)
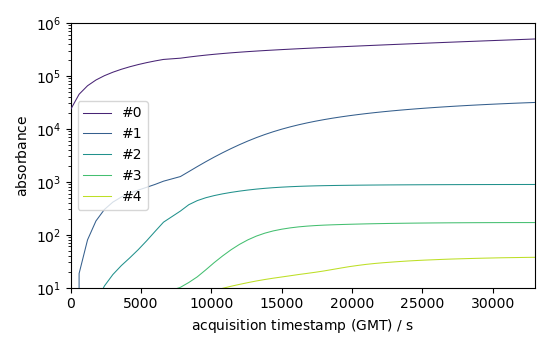
<_Axes: xlabel='acquisition timestamp (GMT) $\\mathrm{/\\ \\mathrm{s}}$', ylabel='relative concentration $\\mathrm{}$'>
Total running time of the script: ( 0 minutes 3.057 seconds)