spectrochempy.PCA.screeplot
- PCA.screeplot(n_pc=None, **kwargs)[source]
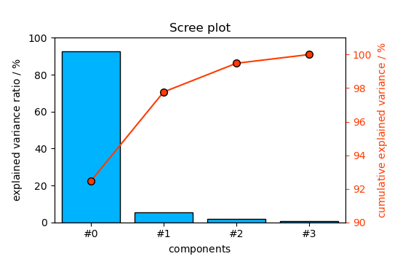
Scree plot of explained variance + cumulative variance by PCA.
Explained variance by each PC is plot as a bar graph (left y axis) and cumulative explained variance is plot as a scatter plot with lines (right y axis).
- Parameters
n_pc (int) – Number of components to plot.
**kwargs – Extra arguments:
colors(default:[NBlue, NRed]) to set the colors of the bar plot and scatter plot;ylims(default[(0, 100), "auto"]).
- Returns
list of axes – The list of axes.