spectrochempy.NDDataset.plot
- NDDataset.plot(method=None, **kwargs)[source]
Generic plot function.
This apply to a
NDDatasetbut actually delegate the work to a plotter defined by the keyword parametermethod.- Parameters
method (str, optional, default: “generic”) – Specify with plot method to use.
**kwargs – Any optional parameters to pass to the plot method. See plot_1D, plot_2D and plot_3D for a liste of possible arguments.
- Returns
axe – The axe instance on which the plot has bee performed.
See also
plot_1D,plot_pen,plot_bar,plot_scatter_pen,plot_multiple,plot_2D,plot_stack,plot_map,plot_image,plot_1D,plot_surface,plot_waterfall,multiplotExamples
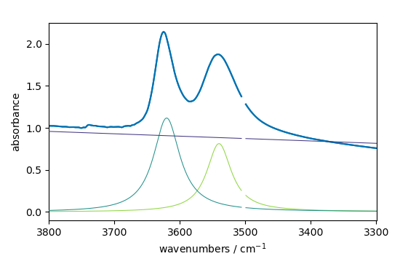
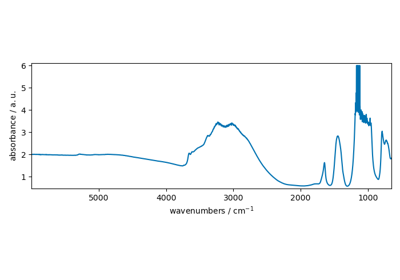
For 1D data, the default plot is done with method scatter
>>> nd = scp.NDDataset([1, 2, 3])
>>> _ = nd.plot()  # default to method="scatter"
or >>> _ = nd.plot(method=”scatter”)
Equivalently, one can also specify the method to use as follow: >>> _ = nd.plot_scatter() >>> _ = nd.plot_1D()
For
Examples using spectrochempy.NDDataset.plot
EFA analysis (Keller and Massart original example)

Sine bell and squared Sine bell window multiplication