spectrochempy.IRIS
- class IRIS(X, K, p=None, q=None, reg_par=None)[source]
Integral inversion solver for spectroscopic data.
Solves integral equations of the first kind of 1 or 2 dimensions, i.e. returns a distribution f of contributions to 1D ou 2D datasets.
- Parameters
X (NDDataset) – The 1D or 2D dataset on which to perform the IRIS analysis.
K (str or callable or NDDataset) – Kernel of the integral equation. Pre-defined kernels can be chosen among
["langmuir", "ca", "reactant-first-order", "product-first-order", "diffusion"].p (Coord or Iterable) – External variable. Must be provided if the kernel is passed as a str or callable.
q (Coord or Iterable of 3 values) – Internal variable. Must be provided if the kernel is passed as a str or callable.
reg_par (None or array_like of two values
[min, max]or three values[start, stop, num]) – Regularization parameter.
- SM[source]
Values of the regularization constraint (one per regularization parameter).
- Type
array of float
See also
kerCompute kernel of Fredholm equation of the 1st kind.
Notes
IRIS solves integral equation of the first kind of 1 or 2 dimensions, i.e. finds a distribution function \(f(p)\) or \(f(c,p)\) of contributions to univariate data \(a(p)\) or multivariate \(a(c, p)\) data evolving with an external experimental variable \(p\) (time, pressure, temperature, concentration, …) according to the integral transform:
\[a(c, p) = \int_{min}^{max} k(q, p) f(c, q) dq\]\[a(p) = \int_{min}^{max} k(q, p) f(q) dq\]where the kernel \(k(q, p)\) expresses the functional dependence of a single contribution with respect to the experimental variable \(p\) and and ‘internal’ physico-chemical variable \(q\) Regularization is triggered when ‘reg_param’ is set to an array of two or three values. If ‘reg_param’ has two values [min, max], the optimum regularization parameter is searched between \(10^{min}\) and \(10^{max}\). Automatic search of the regularization is made using the Cultrera_Callegaro algorithm (arXiv:1608.04571v2) which involves the Menger curvature of a circumcircle and the golden section search method. If three values are given (
[min, max, num]), then the inversion will be made for num values evenly spaced on a log scale between \(10^{min}\) and \(10^{max}\)Examples
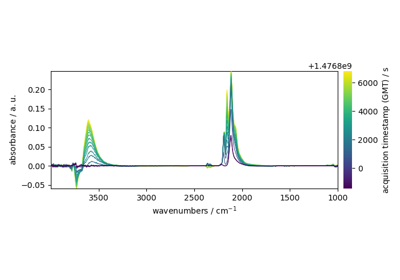
>>> X = scp.read("irdata/CO@Mo_Al2O3.SPG")
>>> p = [0.003, 0.004, 0.009, 0.014, 0.021, 0.026, 0.036, 0.051, 0.093, 0.150,
...      0.203, 0.300, 0.404, 0.503, 0.602, 0.702, 0.801, 0.905, 1.004]
>>> iris = scp.IRIS(X[:,2250.0:1960.0], "langmuir", q = [-8, -1, 10])
>>> iris.f
NDDataset: [float64] unitless (shape: (z:1, y:10, x:301))
Methods
IRIS.plotdistribution([index])Plot the distribution function.
IRIS.plotlcurve([scale, title])Plot the L Curve.
IRIS.plotmerit([index])Plot the input dataset, reconstructed dataset and residuals.
Transform data back to the original space.