spectrochempy.PCA
- class PCA(**kwargs)[source]
Principal Component Analysis.
This class performs a Principal Component Analysis of a
NDDataset, i.e., a linear dimensionality reduction using Singular Value Decomposition (SVD) of the data to perform its projection to a lower dimensional space.The reduction of a dataset \(X\) with shape (
M,`N`) is achieved using the decomposition : \(X = S.L^T\), where \(S\) is the score’s matrix with shape (M,n_pc) and \(L^T\) is the transposed loading’s matrix with shape (n_pc,N).If the dataset
Xcontains masked values, these values are silently ignored in the calculation.- Parameters
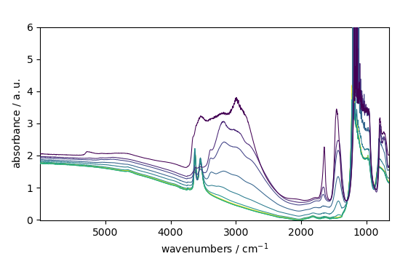
dataset (|NDDataset| object) – The input dataset has shape (M, N). M is the number of observations (for examples a series of IR spectra) while N is the number of features (for example the wavenumbers measured in each IR spectrum).
centered (bool, optional, default:True) – If True the data are centered around the mean values: \(X' = X - mean(X)\).
standardized (bool, optional, default:False) – If True the data are scaled to unit standard deviation: \(X' = X / \sigma\).
scaled (bool, optional, default:False) – If True the data are scaled in the interval [0-1]: \(X' = (X - min(X)) / (max(X)-min(X))\).
See also
Methods
PCA.plotmerit([n_pc])Plots the input dataset, reconstructed dataset and residuals.
PCA.printev([n_pc])Print PCA figures of merit.
PCA.reconstruct([n_pc])Transform data back to the original space using
n_pcPC's.PCA.reduce([n_pc])Apply a dimensionality reduction to the X dataset of shape [M, N].
PCA.scoreplot(self, *pcs[, colormap, ...])2D or 3D scoreplot of samples.
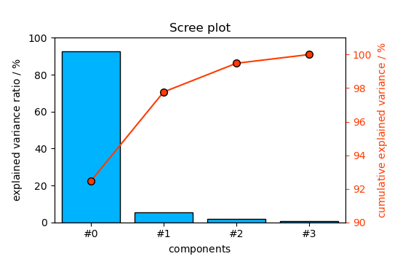
PCA.screeplot([n_pc])Scree plot of explained variance + cumulative variance by PCA.
Attributes
LT.
Explained variances (
NDDataset).Cumulative Explained Variances (
NDDataset).Explained variance per singular values (
NDDataset).- LT
LT.
- S
- X