
Customizing a Plot#
The default plot is designed to look good with minimal effort. However, every visual aspect can be adjusted using keyword arguments passed to ds.plot(). This page covers the most common customizations.
Line Appearance#
For 1D and 2D datasets, you can adjust how lines appear:
[1]:
import os
from pathlib import Path

import spectrochempy as scp

TEST_FILE = Path(os.environ.get("TEST_FILE", "irdata/nh4y-activation.spg"))

ds = scp.read(TEST_FILE)
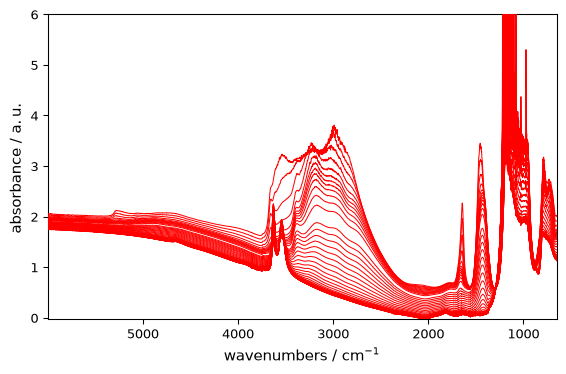
Color#
[2]:
_ = ds.plot(color="red")
Line Width#
[3]:
_ = ds.plot(linewidth=2)
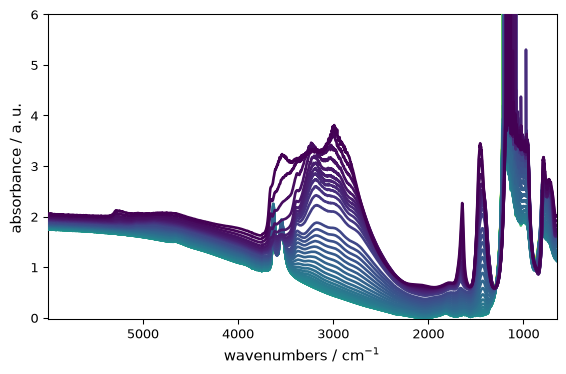
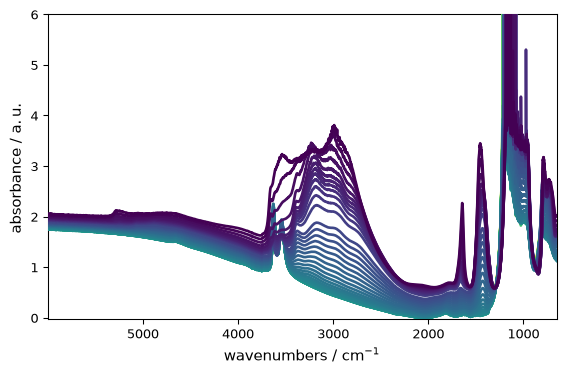
The short alias lw=... is accepted as well:
[4]:
_ = ds.plot(lw=2)
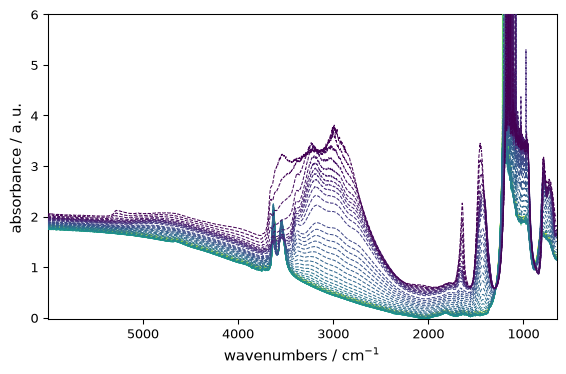
Line Style#
[5]:
_ = ds.plot(linestyle="--")
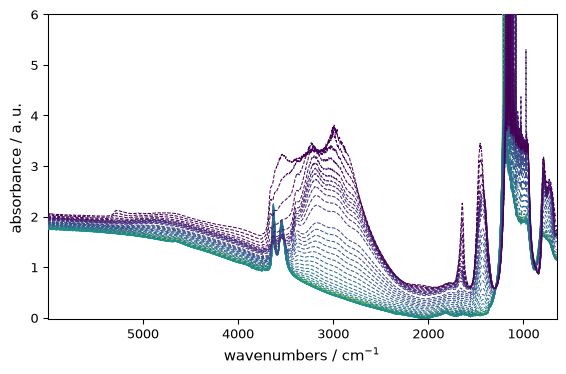
The corresponding short alias is ls=...:
[6]:
_ = ds.plot(ls="--")
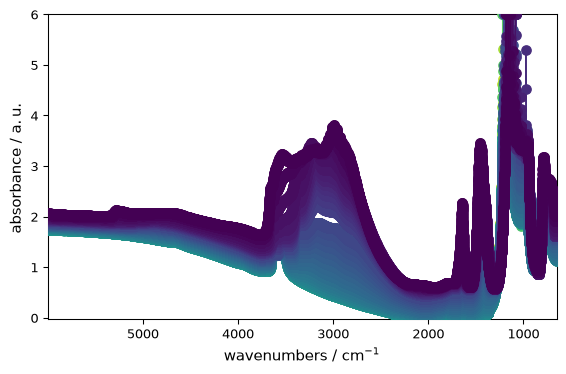
Marker#
[7]:
_ = ds.plot(marker="o")
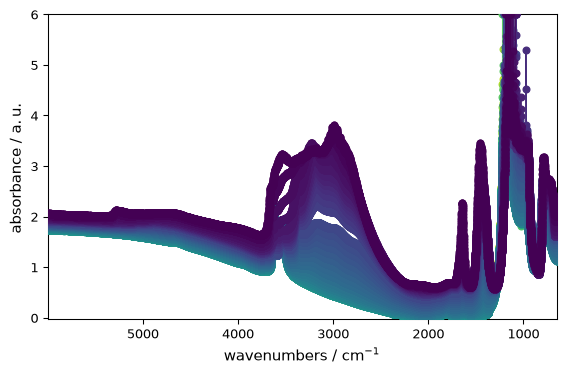
Marker-related aliases such as ms (marker size) and mew (marker edge width) are normalized automatically:
[8]:
_ = ds.plot(marker="o", ms=5, mew=1.5)
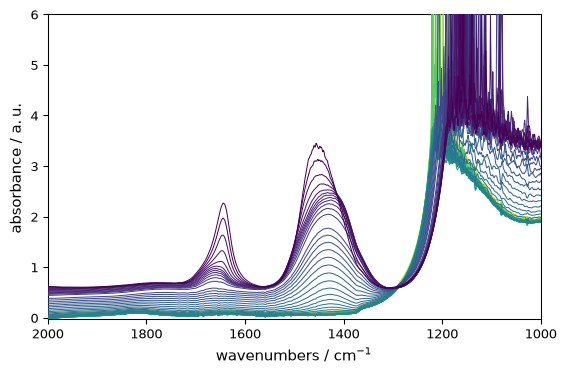
Axis Limits#
Restrict the displayed range:
[9]:
_ = ds.plot(
    xlim=(2000, 1000)
)  # NB: slicing is also possible here, ds[:,2000.:1000.].plot() would give the same result
[10]:
_ = ds.plot(ylim=(0, 0.5))
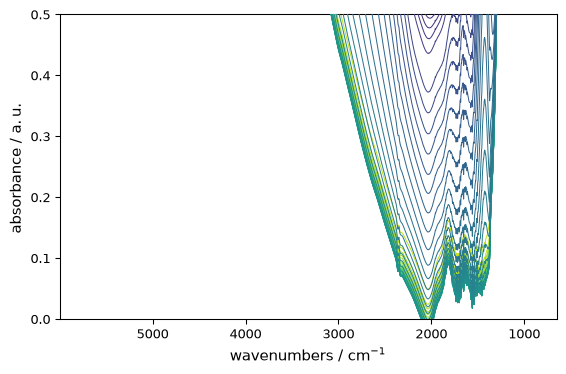
Figure Size#
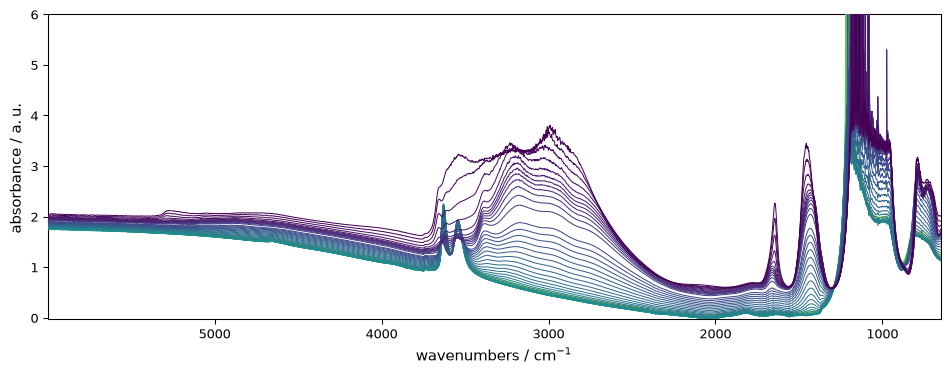
Control the figure dimensions (width, height in inches):
[11]:
_ = ds.plot(figsize=(10, 4))
Titles and Labels#
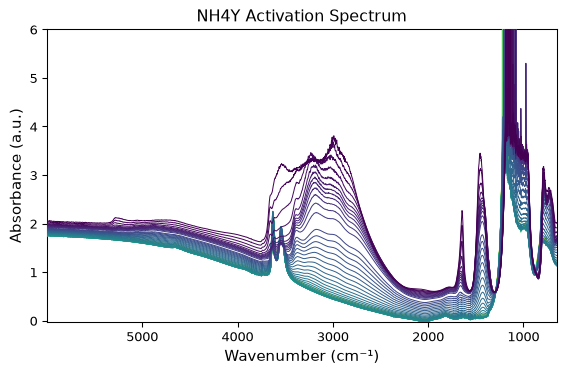
Set the title and labels in the plotting call:
[12]:
_ = ds.plot(
    title="NH4Y Activation Spectrum",
    xlabel="Wavenumber (cm⁻¹)",
    ylabel="Absorbance (a.u.)",
)
Grid#
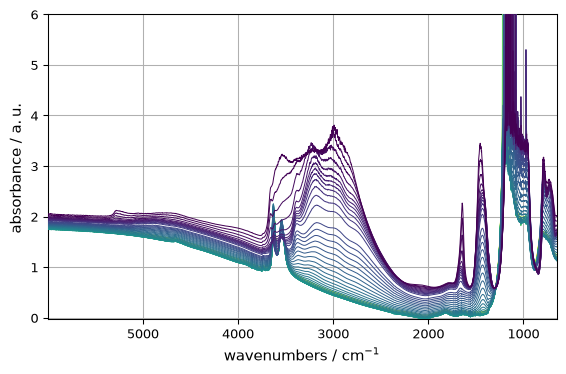
Add a grid for easier reading:
[13]:
_ = ds.plot(grid=True)
Colormap#
As shown in the overview, change colors using the cmap argument:
[14]:
_ = ds.plot(cmap="viridis")
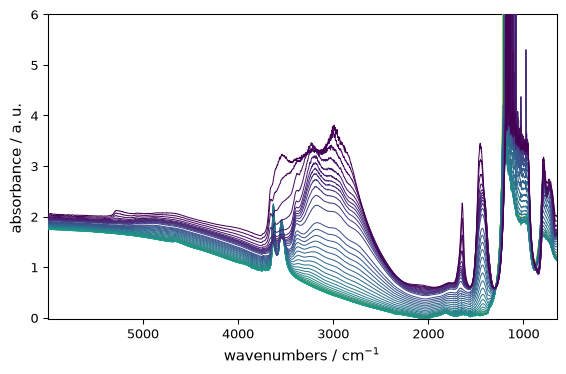
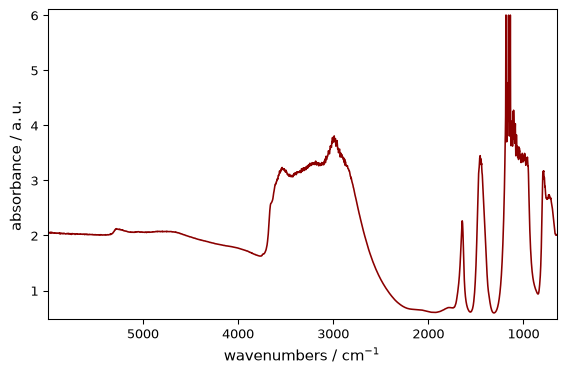
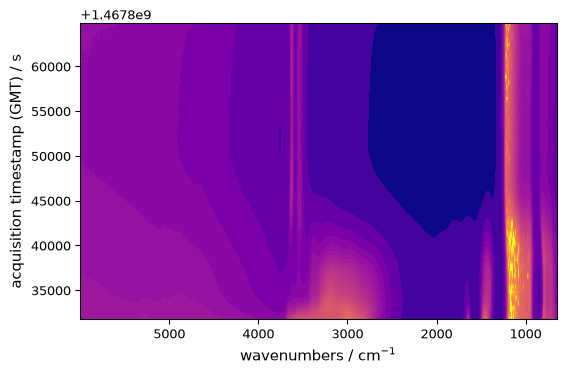
The aliases c=... for line color and colormap=... for cmap=... are also accepted:
[15]:
_ = ds[0].plot(c="darkred")
[16]:
_ = ds.plot_image(colormap="plasma")
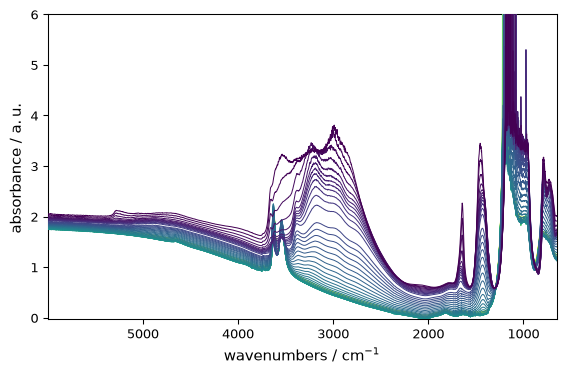
Categorical Colors (cmap=None)#
For line plots, passing cmap=None uses categorical colors instead of a continuous colormap:
[17]:
_ = ds.plot_lines(cmap=None)
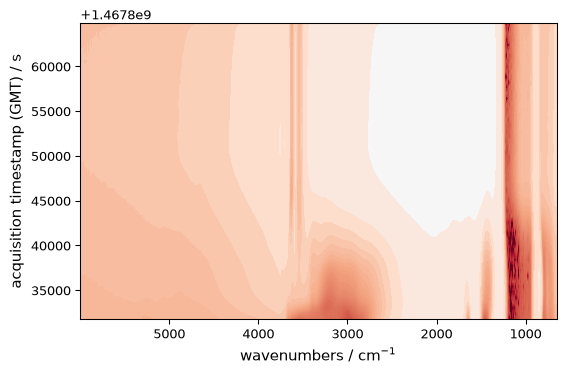
Colormap Normalization#
You can customize how colors map to values using Matplotlib’s normalization classes:
[18]:
import matplotlib as mpl

# Centered norm - useful for data with a natural center (e.g., deviations from mean)
norm = mpl.colors.CenteredNorm()
_ = ds.plot_image(cmap="RdBu_r", norm=norm)
[19]:
# Log norm - useful for data spanning several orders of magnitude
norm = mpl.colors.LogNorm(vmin=0.01, vmax=1.0)
_ = ds.plot_image(cmap="viridis", norm=norm)

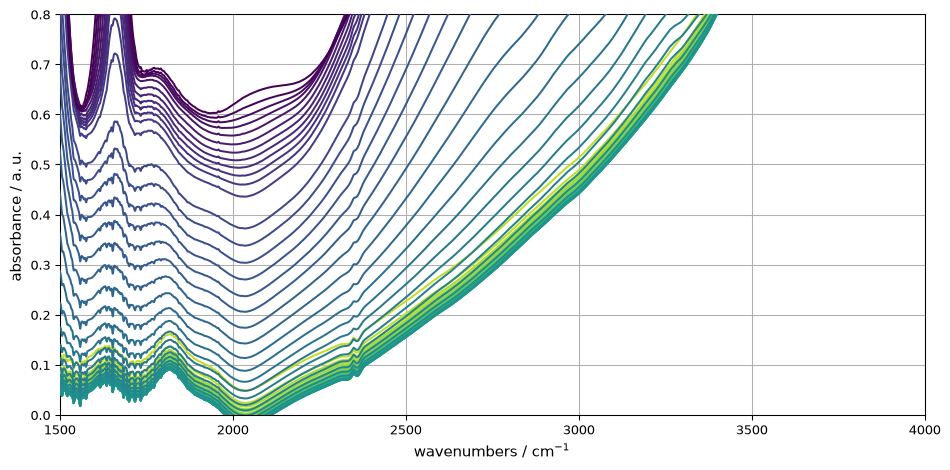
Combining Customizations#
Most arguments can be combined for a tailored plot:
[20]:
_ = ds.plot(
    xlim=(1500, 4000),
    ylim=(0, 0.8),
    linewidth=1.5,
    linestyle="-",
    grid=True,
    figsize=(10, 5),
)
Composite Plot Customization#
Analysis and comparison plots such as plot_score, plot_compare, plot_merit, plot_baseline, and plot_parity accept keyword arguments for fine-grained control over visual appearance.
Score Plot: Marker and Transparency#
The plot_score function (accessible via PCA.plot_score or standalone scp.plot_score) supports marker, s (marker size), and alpha (transparency). For a PCA model fitted on the dataset used above:
[21]:
pca = scp.PCA(n_components=3)
pca.fit(ds)
_ = pca.plot_score(marker="s", s=30, alpha=0.7)

These parameters are forwarded to matplotlib.axes.Axes.scatter.
Compare / Merit Plot: Line Style Parameters#
The plot_compare function accepts domain-specific keyword aliases for style control:
Parameter |
Effect |
Default |
|---|---|---|
|
Line style per category |
|
|
Line width per category |
|
|
Color per category |
Semantic defaults |
|
Vertical separation between groups |
|
|
Number of traces to display |
|
Example, comparing the dataset with its PCA reconstruction:
[22]:
_ = scp.plot_compare(
    ds,
    pca.inverse_transform(),
    exp_linestyle="-",
    calc_linestyle=":",
    exp_linewidth=1.5,
    calc_linewidth=2.0,
    offset=0.1,
)

Parity Plot: Scatter Parameters#
The plot_parity function (accessible via pls.plot_parity or standalone scp.plot_parity) passes keyword arguments directly to matplotlib.axes.Axes.scatter:
plot_parity(Y, Y_hat, s=20, marker="o", alpha=0.5, c="tab:blue")
Lifecycle Control for Composites#
All composite functions accept the same lifecycle parameters:
ax: Existing axes to plot on (creates new figure ifNone).clear: Whether to clear the axes before plotting (Trueby default; set toFalseto overlay on existing axes).show: Whether to display the figure (Trueby default).
[23]:
import matplotlib.pyplot as plt

_, (ax1, ax2) = plt.subplots(1, 2, figsize=(12, 4))
_ = pca.plot_score(ax=ax1, show=False)
_ = pca.plot_scree(ax=ax2, show=True)

The Mental Model#
To summarize:
ds.plot()gives you a clean default.Keyword arguments customize a single plot.
The returned Axes object provides full Matplotlib control.
Composite plots (
plot_score,plot_compare, etc.) have their own domain-specific parameters but follow the sameax/clear/showcontract.Persistent changes across sessions are handled via
scp.preferences(covered elsewhere).
These tools cover most day-to-day plotting needs.