Basic transformations
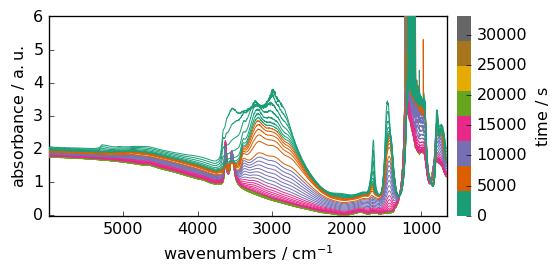
Let’s show some SpectroChemPy features on a group of IR spectra
[1]:
import spectrochempy as scp
from spectrochempy import MASKED, DimensionalityError, error_

|
SpectroChemPy's API - v.0.6.9.dev9 © Copyright 2014-2024 - A.Travert & C.Fernandez @ LCS |
[2]:
dataset = scp.read_omnic("irdata/nh4y-activation.spg")
dataset.y -= dataset.y[0]
dataset.y.title = "time"
dataset
[2]:
| name | nh4y-activation |
| author | runner@fv-az1501-19 |
| created | 2024-04-28 03:09:27+02:00 |
| description | Omnic title: NH4Y-activation.SPG Omnic filename: /home/runner/.spectrochempy/testdata/irdata/nh4y-activation.spg |
| history | 2024-04-28 03:09:27+02:00> Imported from spg file /home/runner/.spectrochempy/testdata/irdata/nh4y-activation.spg. 2024-04-28 03:09:27+02:00> Sorted by date |
| DATA | |
| title | absorbance |
| values | [[ 2.057 2.061 ... 2.013 2.012] [ 2.033 2.037 ... 1.913 1.911] ... [ 1.794 1.791 ... 1.198 1.198] [ 1.816 1.815 ... 1.24 1.238]] a.u. |
| shape | (y:55, x:5549) |
| DIMENSION `x` | |
| size | 5549 |
| title | wavenumbers |
| coordinates | [ 6000 5999 ... 650.9 649.9] cm⁻¹ |
| DIMENSION `y` | |
| size | 55 |
| title | time |
| coordinates | [ 0 600 ... 3.24e+04 3.3e+04] s |
| labels | [[ 2016-07-06 19:03:14+00:00 2016-07-06 19:13:14+00:00 ... 2016-07-07 04:03:17+00:00 2016-07-07 04:13:17+00:00] [ vz0466.spa, Wed Jul 06 21:00:38 2016 (GMT+02:00) vz0467.spa, Wed Jul 06 21:10:38 2016 (GMT+02:00) ... vz0520.spa, Thu Jul 07 06:00:41 2016 (GMT+02:00) vz0521.spa, Thu Jul 07 06:10:41 2016 (GMT+02:00)]] |
[3]:
prefs = dataset.preferences
prefs.figure.figsize = (6, 3)
prefs.colormap = "Dark2"
prefs.colorbar = True
ax = dataset.plot()
Masking data
if we try to get for example the maximum of this dataset, we face a problem due to the saturation around 1100 cm\(^{-1}\).
[4]:
dataset.max()
[4]:
One way is to apply the max function to only a part of the spectrum (using slicing). Another way is to mask the undesired data.
Masking values in this case is straightforward. Just set a value masked or True for those data you want to mask.
[5]:
dataset[:, 1290.0:890.0] = MASKED
# note that we specify floating values in order to sect wavenumbers, not index.
Here is a display the figure with the new mask
[6]:
_ = dataset.plot_stack()
Now the max function return the maximum in the unmasked region, which is exactly what we wanted.
[7]:
dataset.max()
[7]:
To clear this mask, we can simply do:
[8]:
dataset.remove_masks()
_ = dataset.plot()

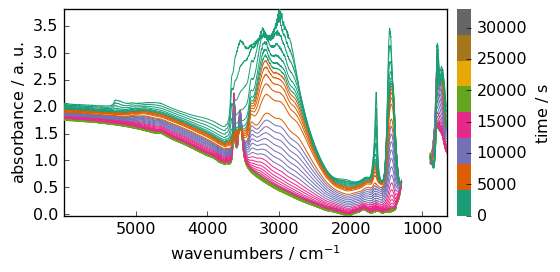
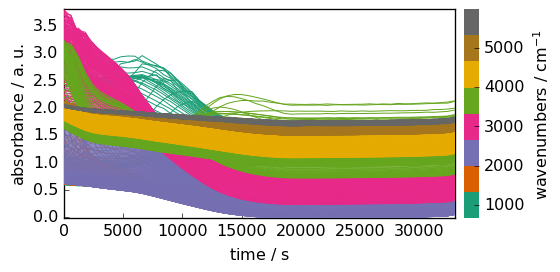
Transposition
Dataset can be transposed
[9]:
dataset[:, 1290.0:890.0] = MASKED  # we mask the unwanted columns
datasetT = dataset.T
datasetT
[9]:
| name | nh4y-activation |
| author | runner@fv-az1501-19 |
| created | 2024-04-28 03:09:27+02:00 |
| description | Omnic title: NH4Y-activation.SPG Omnic filename: /home/runner/.spectrochempy/testdata/irdata/nh4y-activation.spg |
| history | 2024-04-28 03:09:27+02:00> Imported from spg file /home/runner/.spectrochempy/testdata/irdata/nh4y-activation.spg. 2024-04-28 03:09:27+02:00> Sorted by date 2024-04-28 03:09:29+02:00> Data transposed |
| DATA | |
| title | absorbance |
| values | [[ 2.057 2.033 ... 1.794 1.816] [ 2.061 2.037 ... 1.791 1.815] ... [ 2.013 1.913 ... 1.198 1.24] [ 2.012 1.911 ... 1.198 1.238]] a.u. |
| shape | (x:5549, y:55) |
| DIMENSION `x` | |
| size | 5549 |
| title | wavenumbers |
| coordinates | [ 6000 5999 ... 650.9 649.9] cm⁻¹ |
| DIMENSION `y` | |
| size | 55 |
| title | time |
| coordinates | [ 0 600 ... 3.24e+04 3.3e+04] s |
| labels | [[ 2016-07-06 19:03:14+00:00 2016-07-06 19:13:14+00:00 ... 2016-07-07 04:03:17+00:00 2016-07-07 04:13:17+00:00] [ vz0466.spa, Wed Jul 06 21:00:38 2016 (GMT+02:00) vz0467.spa, Wed Jul 06 21:10:38 2016 (GMT+02:00) ... vz0520.spa, Thu Jul 07 06:00:41 2016 (GMT+02:00) vz0521.spa, Thu Jul 07 06:10:41 2016 (GMT+02:00)]] |
As it can be observed the dimension xand yhave been exchanged, e.g. the original shape was (x: 5549, y: 55), and after transposition it is (y:55, x:5549). (the dimension names stay the same, but the index of the corresponding axis are exchanged).
Let’s visualize the result:
[10]:
_ = datasetT.plot()
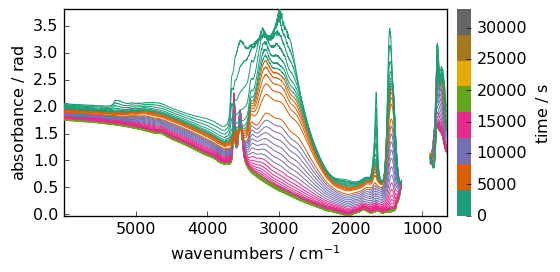
Changing units
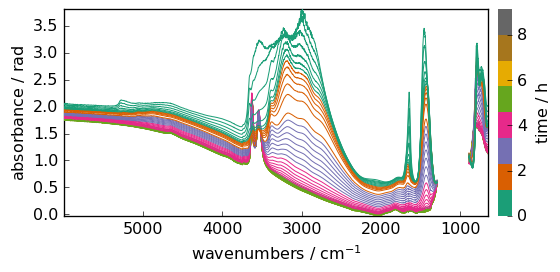
Units of the data and coordinates can be changed, but only towards compatible units. For instance, data are in absorbance units, which are dimensionless (a.u). So a dimensionless units such as radian is allowed, even if in this case it makes very little sense.
[11]:
dataset.units = "radian"
[12]:
_ = dataset.plot()
Trying to change it in ‘meter’ for instance, will generate an error!
[13]:
try:
    dataset.to("meter")
except DimensionalityError as e:
    error_(DimensionalityError, e)
ERROR | DimensionalityError: Cannot convert from 'radian' (dimensionless) to 'meter' ([length])
If this is for some reasons something you want to do, you must for the change:
[14]:
d = dataset.to("meter", force=True)
print(d.units)
m
When units are compatible there is no problem to modify it. For instance, we can change the y dimension units ( Time) to hours. Her we use the inplace transformation ito .
[15]:
dataset.y.ito("hours")
_ = dataset.plot()
See Units and Quantities for more details on these units operations