Examples#

Many examples on the use of the API can be found in this gallery.

Notebook and standalone python scripts can be downloaded using the link at the bottom of each example.

Please note that the number of examples is currently quite limited. We are actively working to improve this. If you have examples to suggest from your own use of spectrochempy, don’t hesitate to suggest them in the discussions or by creating a pull-request.

See the full NMR gallery.

Datasets and plotting#

How to use NDDataset#

This section contains examples of how to use the NDDataset class.
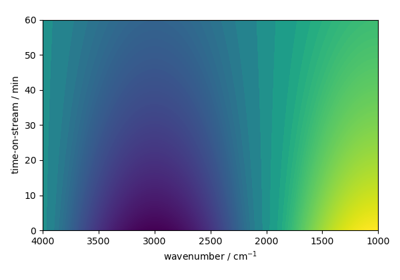
NDDataset creation and plotting example

NDDataset creation and plotting example

NDDataset coordinates example

NDDataset coordinates example

Units manipulation examples

Units manipulation examples

Slice an NDDataset with indices and coordinates

Slice an NDDataset with indices and coordinates

Interoperability#

These examples show how to exchange SpectroChemPy datasets with other scientific Python tools and portable file formats.

Interoperability with xarray and NetCDF

Interoperability with xarray and NetCDF

Import / Export#

This section contains examples of how to import and export data from/to various file formats.
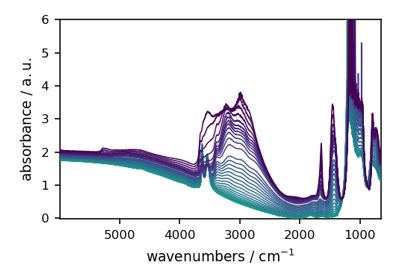
Reading datasets

Reading datasets

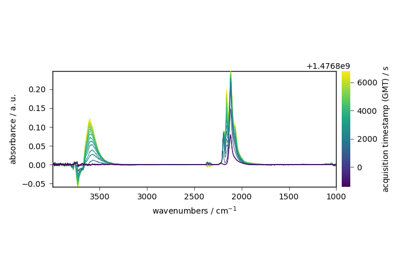
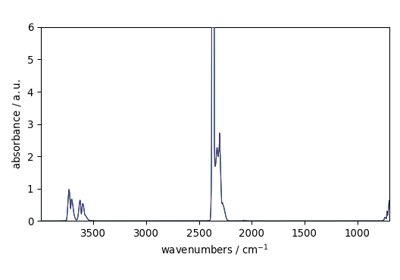
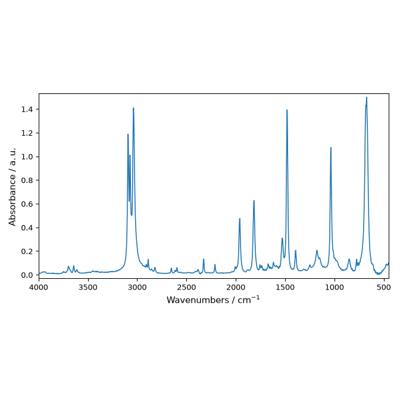
Loading an IR (omnic SPG) experimental file

Loading an IR (omnic SPG) experimental file

Loading Bruker OPUS files

Loading Bruker OPUS files

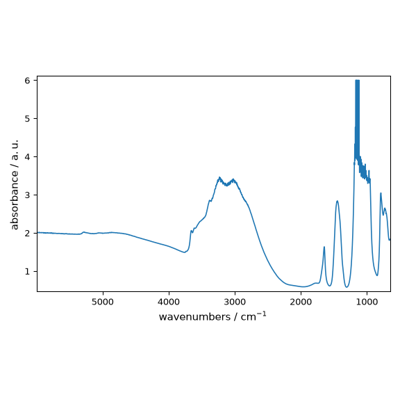
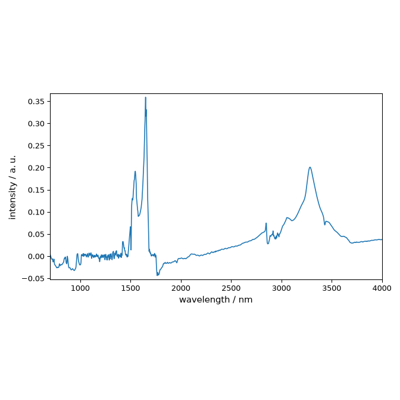
Reading a PerkinElmer SP file (plugin)

Reading a PerkinElmer SP file (plugin)

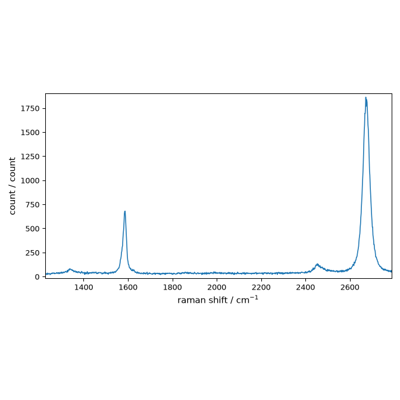
Loading RAMAN experimental file

Loading RAMAN experimental file

Read an experimental Raman spectrum from JCAMP-DX

Read an experimental Raman spectrum from JCAMP-DX

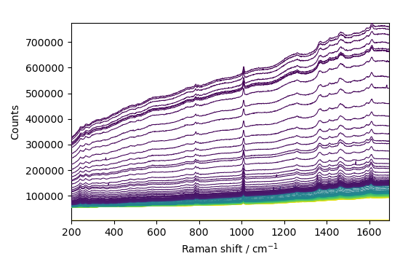
Reading Renishaw WiRE files

Reading Renishaw WiRE files

Reading Galactic SPC files

Reading Galactic SPC files

Read a UV-visible spectrum from JCAMP-DX

Read a UV-visible spectrum from JCAMP-DX

Exchange a spectrum with Excel using CSV

Exchange a spectrum with Excel using CSV

Write and read an infrared spectrum in JCAMP-DX

Write and read an infrared spectrum in JCAMP-DX

Save and reload a native SpectroChemPy dataset

Save and reload a native SpectroChemPy dataset
Read a Bruker TopSpin 1D FID Read a JEOL 1D FID Read a raw JEOL 2D COSY Read a processed NMRPipe 2D COSY

Plotting datasets#

This section contains examples of how to plot datasets.
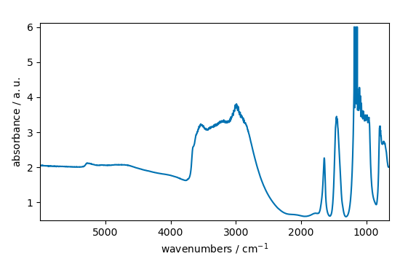
Introduction to the plotting library

Introduction to the plotting library

Show complex components and masks in 1D

Show complex components and masks in 1D

Add projections to a 2D contour plot

Add projections to a 2D contour plot

Using plot_multiple to plot several datasets on the same figure
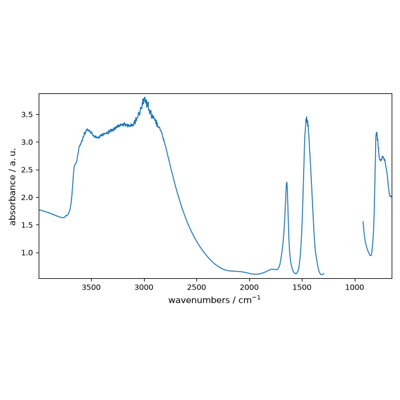
Using plot_multiple to plot several datasets on the same figure
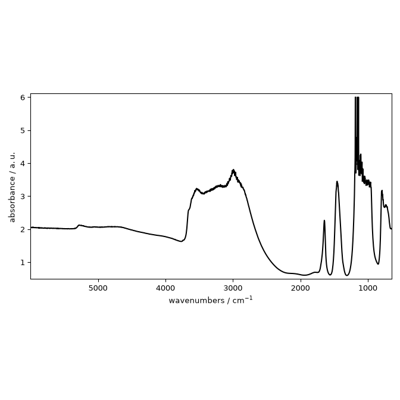
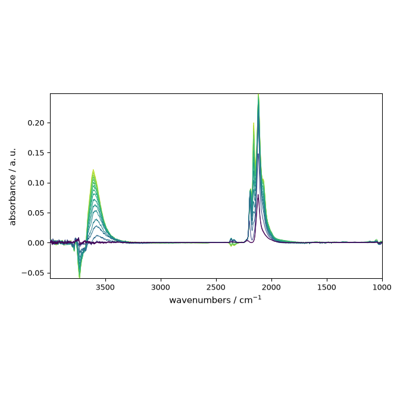
Choose an explicit plot type for a 2D IR dataset

Choose an explicit plot type for a 2D IR dataset

Apply built-in plotting styles

Apply built-in plotting styles

Project Management#

This section contains examples of how to manage projects with spectrochempy.
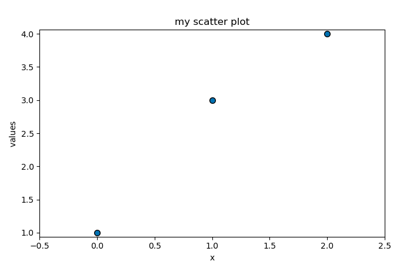
Project creation

Project creation

Processing#

Apodization#

Baseline#

This section contains examples of how to correct the baseline of NDDatasets.
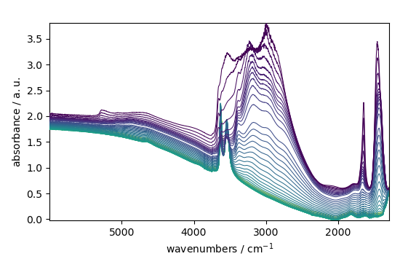
NDDataset baseline correction

NDDataset baseline correction

Denoising#

This section contains examples of how to denoise NDDatasets.
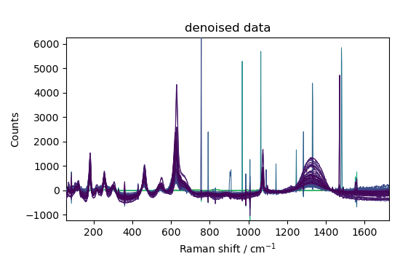
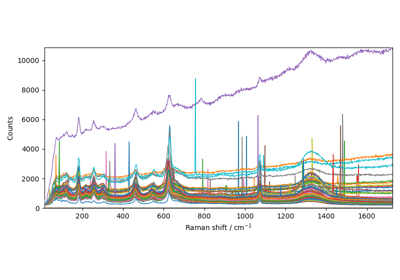
Denoising a 2D Raman spectrum

Denoising a 2D Raman spectrum

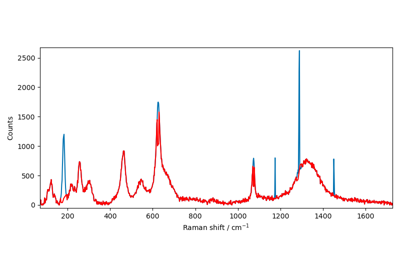
Removing cosmic ray spikes from a Raman spectrum

Removing cosmic ray spikes from a Raman spectrum

Filtering#

This section contains examples of how to filter NDDatasets.

Compare spectral smoothers on noisy peaks

Compare spectral smoothers on noisy peaks

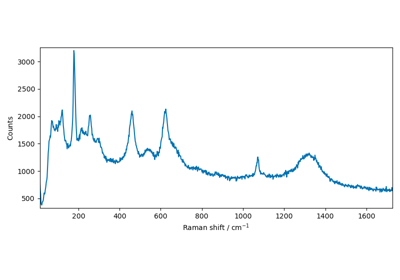
Savitzky-Golay and Whittaker-Eilers smoothing of a Raman spectrum
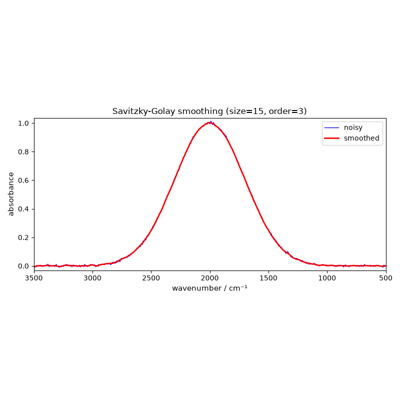
Savitzky-Golay and Whittaker-Eilers smoothing of a Raman spectrum

Savitzky-Golay derivatives on a synthetic spectrum
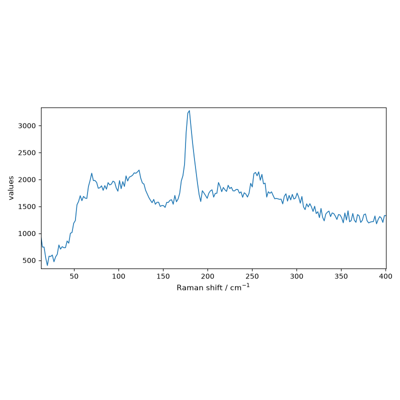
Savitzky-Golay derivatives on a synthetic spectrum

Compare smoothing window sizes on a Raman spectrum

Compare smoothing window sizes on a Raman spectrum

NMR processing#

Processing Raman datasets#
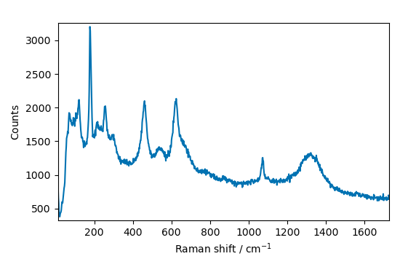
Processing RAMAN spectra

Processing RAMAN spectra

Transformations#

This section contains examples of common masking, transposition, and unit conversion workflows on NDDatasets.
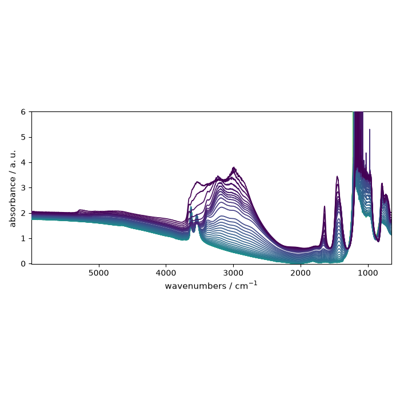
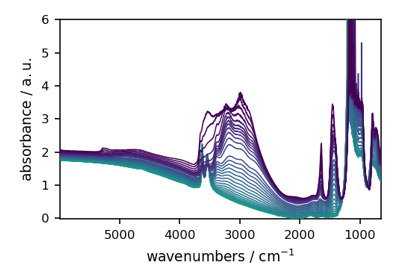
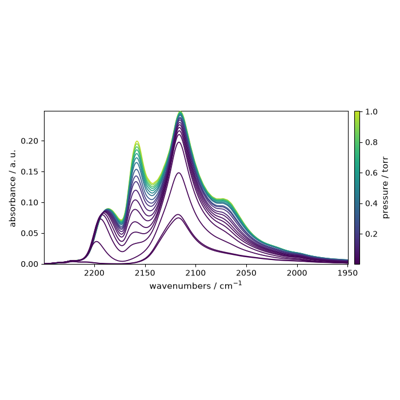
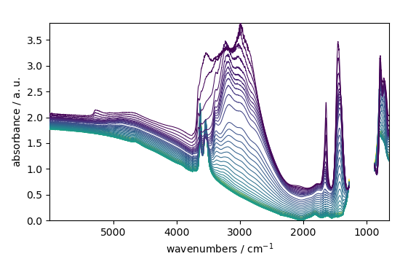
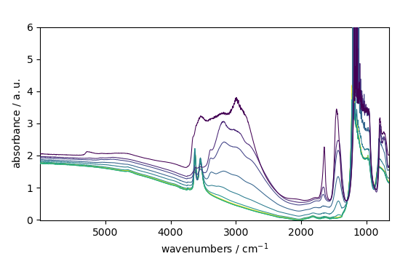
Mask a saturated region and transform an IR dataset
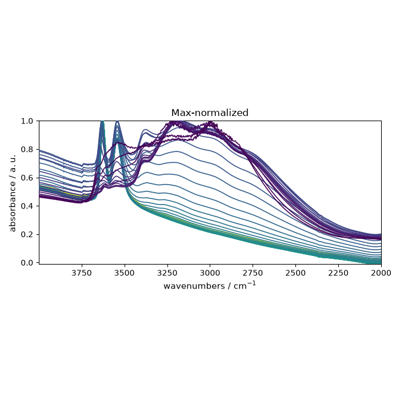
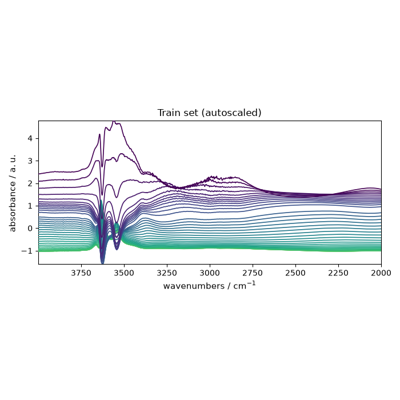
Mask a saturated region and transform an IR dataset

Chemometric preprocessing

Chemometric preprocessing

Preprocessing transformers and scikit-learn compatibility

Preprocessing transformers and scikit-learn compatibility

Analysis#

Decomposition#
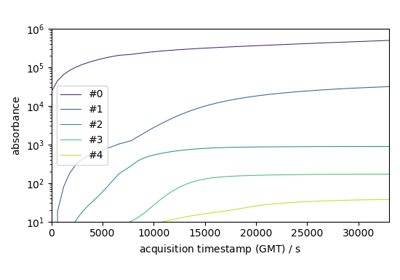
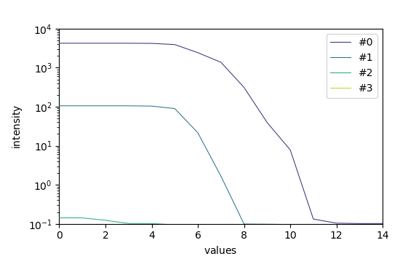
EFA example

EFA example

EFA (Keller and Massart original example)

EFA (Keller and Massart original example)

FastICA example

FastICA example

IRIS: 2D-IRIS analysis (plugin)

IRIS: 2D-IRIS analysis (plugin)

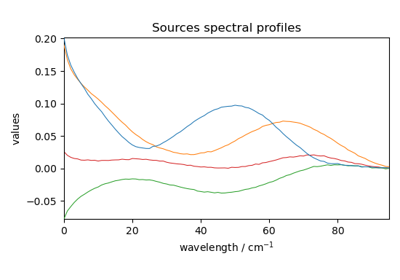
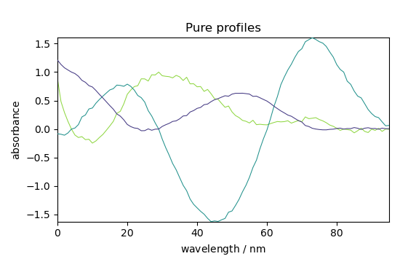
MCR-ALS example (adapted from Jaumot et al. 2005)

MCR-ALS example (adapted from Jaumot et al. 2005)

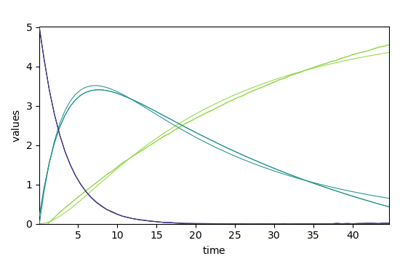
MCR-ALS with kinetic constraints

MCR-ALS with kinetic constraints

NMF analysis example

NMF analysis example

PCA example (iris dataset)

PCA example (iris dataset)

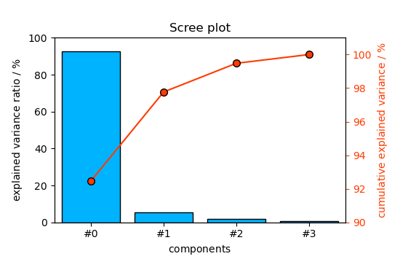
PCA analysis example

PCA analysis example

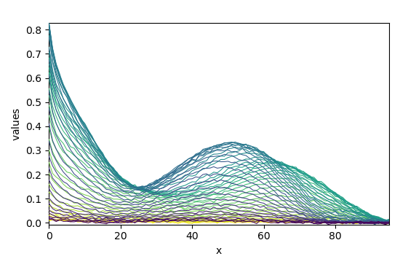
SIMPLISMA example

SIMPLISMA example

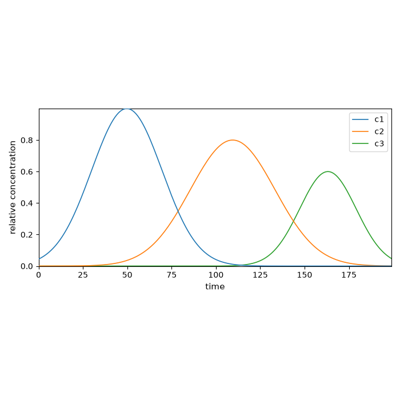
Build synthetic concentration profiles

Build synthetic concentration profiles

Decompose a 3D dataset with CP/PARAFAC

Decompose a 3D dataset with CP/PARAFAC

Cross-decomposition#

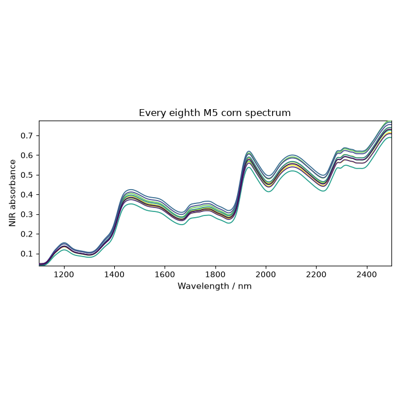
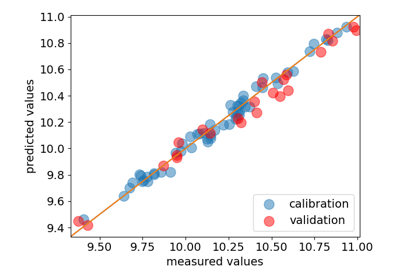
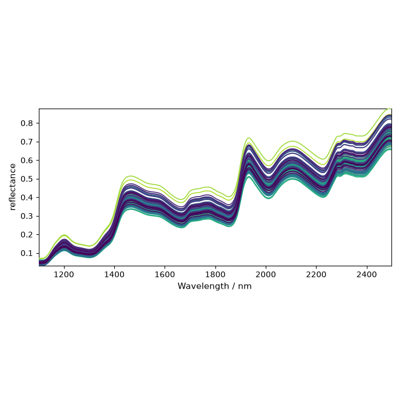
Cross-validation of corn moisture models

Cross-validation of corn moisture models

PLS regression example

PLS regression example

PLS regression with a Pipeline

PLS regression with a Pipeline

Curvefitting#

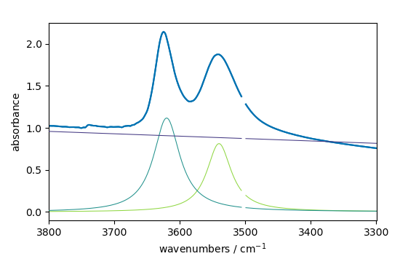
Fitting 1D dataset

Fitting 1D dataset

Fit overlapping peaks in a 2D spectrum

Fit overlapping peaks in a 2D spectrum

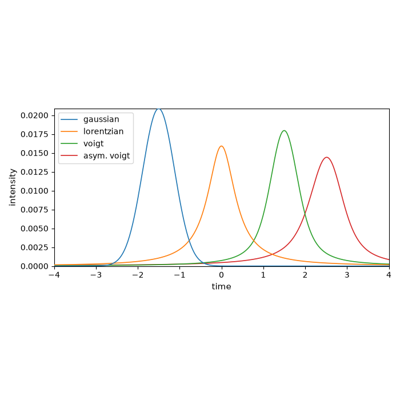
Built-in line-shape helpers

Built-in line-shape helpers

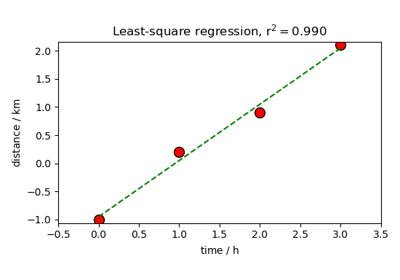
Solve a linear equation using LSTSQ

Solve a linear equation using LSTSQ

Peak analysis#

This section contains peak detection, peak integration, and two-dimensional correlation spectroscopy examples, including experimental 2D spectra.

Explore an IR activation series with Noda’s 2D-COS
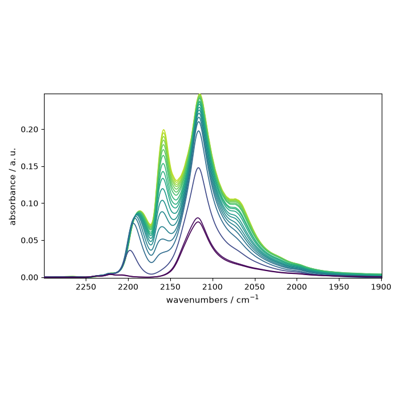
Explore an IR activation series with Noda's 2D-COS

Find peak maxima in an IR time series

Find peak maxima in an IR time series

Find peaks in an experimental 2D-IR spectrum

Find peaks in an experimental 2D-IR spectrum

Integrate a baseline-corrected IR band

Integrate a baseline-corrected IR band

Integrate a 2D peak and estimate its uncertainty

Integrate a 2D peak and estimate its uncertainty
Find and integrate cross-peaks in a 2D COSY Find and fit peaks in a 1D NMR spectrum

NMR series analysis#

Modeling and simulation#

PULSAR#

Simulate solid-state NMR spectra with PULSAR and the SpectroChemPy NMR plugin.

Plugins#

The examples listed below require one or more optional SpectroChemPy plugins. They appear in the main gallery alongside core-only examples, organised by scientific topic.

See Plugins for general plugin installation instructions.