Advanced Matplotlib Integration
SpectroChemPy plots return Matplotlib Axes objects, giving you full access to Matplotlib’s capabilities.
Modifying the Axes
After plotting, customize using Matplotlib methods:
[1]:
import spectrochempy as scp

ds = scp.read("irdata/nh4y-activation.spg")
ds1 = ds[0]
[2]:
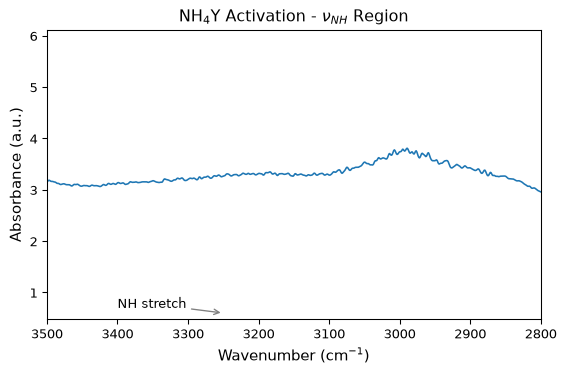
ax = ds1.plot()
_ = ax.set_title(r"NH$_4$Y Activation - $\nu_{NH}$ Region")
_ = ax.set_xlabel(r"Wavenumber (cm$^{-1}$)")
_ = ax.set_ylabel("Absorbance (a.u.)")
_ = ax.set_xlim(3500, 2800)
_ = ax.annotate(
    "NH stretch",
    xy=(3250, 0.6),
    xytext=(3400, 0.7),
    arrowprops={"arrowstyle": "->", "color": "gray"},
)
Multiple Plots
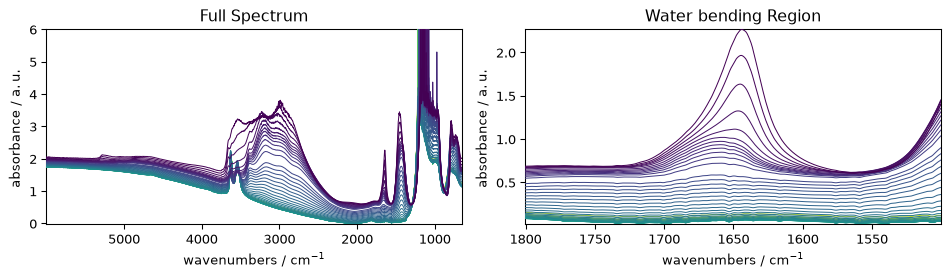
Create separate plots with different settings:
[3]:
import matplotlib.pyplot as plt

fig, (ax1, ax2) = plt.subplots(1, 2, figsize=(10, 3))

# Plot 1: full spectrum
_ = ds.plot(ax=ax1)
ax1.set_title("Full Spectrum")

# Plot 2: subset
_ = ds[:, 1800.0:1500.0].plot(ax=ax2)
ax2.set_title("Water bending Region")

plt.tight_layout()
Colormap Normalization
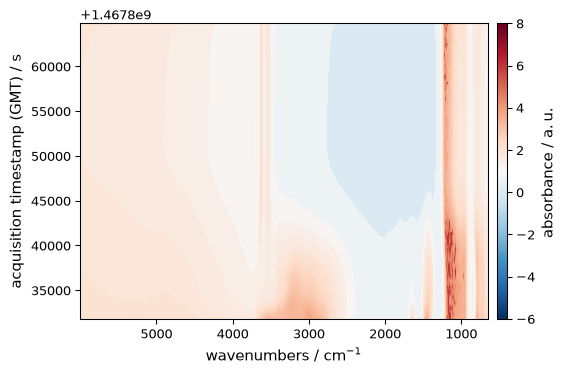
Advanced colormap normalization for special data scenarios:
[4]:
import matplotlib as mpl

# CenteredNorm - centers the colormap around a specific value
norm = mpl.colors.CenteredNorm(vcenter=1.0)
_ = ds.plot_image(cmap="RdBu_r", norm=norm, colorbar=True)
LaTeX-like Math in Labels
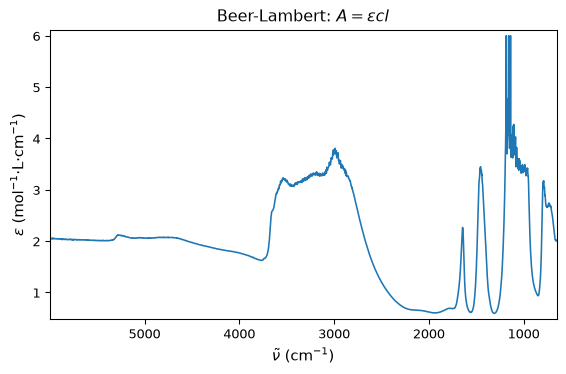
SpectroChemPy supports LaTeX math notation in labels:
[5]:
ax = ds1.plot()
_ = ax.set_xlabel(r"$ \tilde{\nu}$ (cm$^{-1}$)")
_ = ax.set_ylabel(r"$ \epsilon$ (mol$^{-1}$·L·cm$^{-1}$)")
_ = ax.set_title(r"Beer-Lambert: $A = \epsilon c l$")
Reproducibility
Avoid modifying global Matplotlib state. Instead:
Use kwargs for per-plot settings
Use preferences for session defaults
Use styles for theme changes
Example of clean, reproducible plotting:
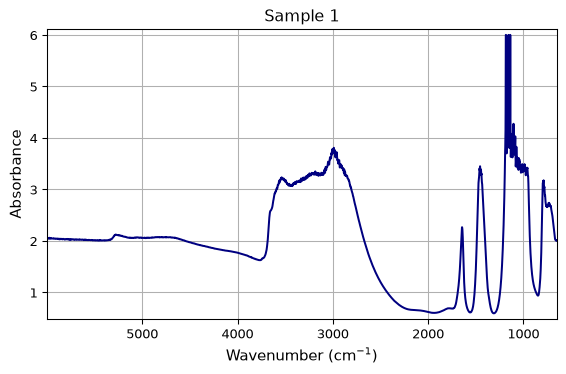
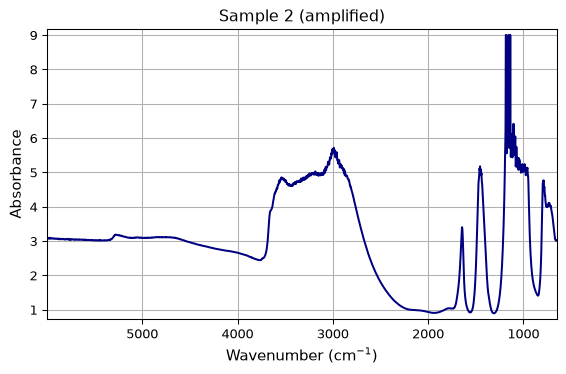
[6]:
def plot_spectrum(dataset, title=None, output_path=None):
    """Plot a spectrum with consistent styling."""
    ax = dataset.plot(
        linewidth=1.5,
        color="navy",
        grid=True,
    )
    if title:
        ax.set_title(title)
    ax.set_xlabel(r"Wavenumber (cm$^{-1}$)")
    ax.set_ylabel("Absorbance")
    return ax


# Each call produces consistent results
ax1 = plot_spectrum(ds1, title="Sample 1")
ax2 = plot_spectrum(ds1 * 1.5, title="Sample 2 (amplified)")
Where to Go Further
SpectroChemPy is built on Matplotlib. For advanced customization:
SpectroChemPy API reference for plot method options
The combination of SpectroChemPy’s convenience with Matplotlib’s power gives you full control over your visualizations.