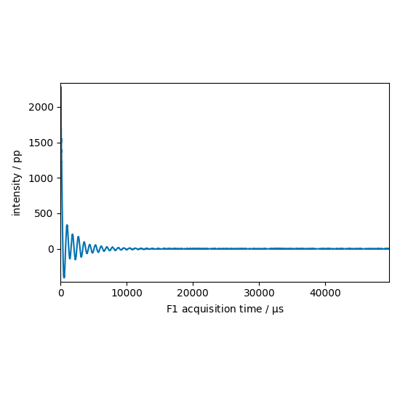
spectrochempy.plot
- plot(self, method=None, **kwargs)[source]
Plot the dataset using the specified method.
- Parameters:
method (str, optional) – Plot method to use. If None, chooses based on dataset dimensionality
**kwargs – Additional plot options passed to the specific plot method
- Returns:
_Axes – Matplotlib axes containing the plot
