Note
Go to the end to download the full example code
PLS regression example
In this example, we perform a PLS regression to predict the moisture of corn samples from their NIR spectra.
Import the spectrochempy API package
import spectrochempy as scp
The data set is available to download from the Eigenvector Archive:
This data set, originally taken at Cargil, consists of 80 samples of corn measured on
3 different NIR spectrometers together with the moisture, oil, protein and starch
values for each of the samples is also included.
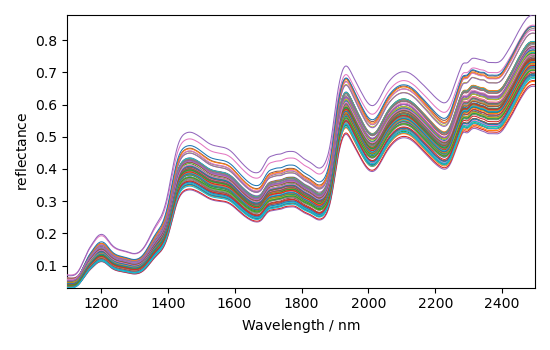
The 5th dataset named 'm5spec', contains the NIR spectra of 80 corn samples recorded
on the same instrument. Let’s assign this NDDataset specta to X, add few
informations and plot it:
%%
The values of the properties we want to predict are in the 4th dattaset named 'propval' dataset:
Y = ds_list[3]
_ = Y.T.plot(cmap=None, legend=Y.x.labels)
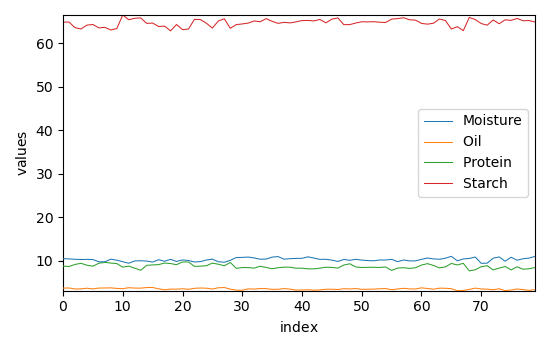
We are interested to predict the moisture content:
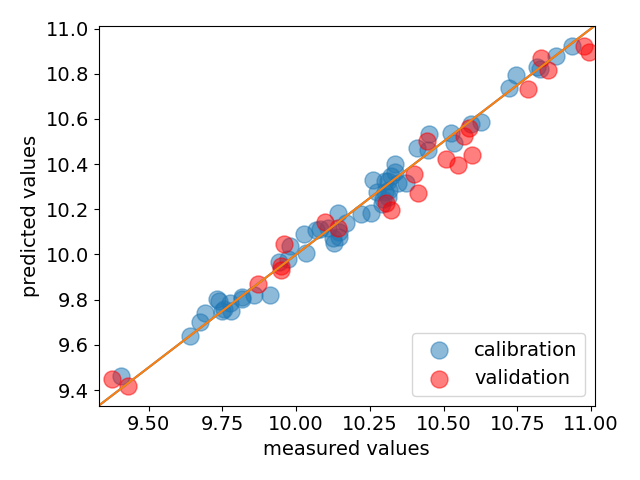
First we select 57 first samples (2/3 of the total) to train/calibrate the model and the remaining ones to test/validate the model:
Then we create a PLSRegression object and fit the train datasets:
Finally we generate a parity plot comparing the predicted and actual values, for both train set and test set.
# sphinx_gallery_thumbnail_number = 3
ax = pls.parityplot(label="calibration", s=150)
_ = pls.parityplot(
    y_test, pls.predict(X_test), s=150, c="red", label="validation", clear=False
)
_ = ax.legend(loc="lower right")
This ends the example ! The following line can be uncommented if no plot shows when running the .py script
# scp.show()
Total running time of the script: ( 0 minutes 1.528 seconds)