spectrochempy.PLSRegression
- class PLSRegression(*, log_level='WARNING', warm_start=False, max_iter=500, n_components=2, scale=True, tol=1e-06)[source]
Partial Least Squares regression (PLSRegression).
The Partial Least Squares regression wraps the
sklearn.cross_decomposition.PLSRegressionmodel, with few additional methods.- Parameters
log_level (any of [
"INFO","DEBUG","WARNING","ERROR"], optional, default:"WARNING") – The log level at startup. It can be changed later on using theset_log_levelmethod or by changing thelog_levelattribute.warm_start (
bool, optional, default:False) – When fitting repeatedly on the same dataset, but for multiple parameter values (such as to find the value maximizing performance), it may be possible to reuse previous model learned from the previous parameter value, saving time.When
warm_startisTrue, the existing fitted model attributes is used to initialize the new model in a subsequent call tofit.max_iter (
int, optional, default: 500) – The maximum number of iterations of the power method when algorithm=’nipals’. Ignored otherwise.n_components (
int, optional, default: 2) – Number of components to keep. Should be in the range [1, min(n_samples, n_features, n_targets)].scale (
bool, optional, default: True) – Whether to scale X and Y.tol (
float, optional, default: 1e-06) – The tolerance used as convergence criteria in the power method:the algorithm stops whenever the squared norm of u_i - u_{i-1} is less than tol, where u corresponds to the left singular vector.
Attributes Summary
Return the X input dataset (eventually modified by the model).
The
Yinput.NDDatasetwith components in feature space (n_components, n_features).traitlets.config.Configobject.Return
logoutput.The maximum number of iterations of the power method when algorithm='nipals'.
Number of components to keep.
Object name
Whether to scale X and Y.
the algorithm stops whenever the squared norm of u_i - u_{i-1} is less than tol, where u corresponds to the left singular vector.
Methods Summary
fit(X, Y)Fit the PLSRegression model on X and Y.
fit_transform(X, Y[, both])Fit the model with
XandYand apply the dimensionality reduction onXand optionally onY.get_components([n_components])Return the component's dataset: (selected n_components, n_features).
inverse_transform([X_transform, ...])Transform data back to its original space.
parameters([replace, removed, default])Alias for
paramsmethod.params([default])Current or default configuration values.
parityplot(self[, Y, Y_hat, clear])Plot the predicted (\(\hat{Y}\)) vs measured (\(Y\)) values.
plotmerit([X, X_hat])Plot the input (
X), reconstructed (X_hat) and residuals.predict([X])Predict targets of given observations.
reconstruct([X_transform])Transform data back to its original space.
reduce([X])Apply dimensionality reduction to
X.reset()Reset configuration parameters to their default values
score([X, Y, sample_weight])Return the coefficient of determination of the prediction.
to_dict()Return config value in a dict form.
transform([X, Y, both])Attributes Documentation
- X
Return the X input dataset (eventually modified by the model).
- components
NDDatasetwith components in feature space (n_components, n_features).See also
get_componentsRetrieve only the specified number of components.
- config
traitlets.config.Configobject.
- log
Return
logoutput.
- max_iter
The maximum number of iterations of the power method when algorithm=’nipals’. Ignored otherwise.
- n_components
Number of components to keep. Should be in the range [1, min(n_samples, n_features, n_targets)].
- name
Object name
- scale
Whether to scale X and Y.
- tol
the algorithm stops whenever the squared norm of u_i - u_{i-1} is less than tol, where u corresponds to the left singular vector.
- Type
The tolerance used as convergence criteria in the power method
Methods Documentation
- fit(X, Y)[source]
Fit the PLSRegression model on X and Y.
- Parameters
X (
NDDatasetor array-like of shape (n_observations, n_features)) – Training data.Y (array-like of shape (n_samples,) or (n_samples, n_targets)) – Target vectors, where n_samples is the number of samples and n_targets is the number of response variables.
- Returns
self – The fitted instance itself.
See also
fit_transformFit the model with an input dataset
Xand apply the dimensionality reduction onX.fit_reduceAlias of
fit_transform(Deprecated).
- fit_transform(X, Y, both=False)[source]
Fit the model with
XandYand apply the dimensionality reduction onXand optionally onY.- Parameters
X (
NDDatasetor array-like of shape (n_observations, n_features)) – Training data.Y (
NDDatasetor array-like of shape (n_observations, n_features)) – Training data.both (
bool, optional) – Whether to apply the dimensionality reduction onXandY.
- Returns
NDDataset– Dataset with shape (n_observations, n_components).
- get_components(n_components=None)
Return the component’s dataset: (selected n_components, n_features).
- Parameters
n_components (
int, optional, default:None) – The number of components to keep in the output dataset. IfNone, all calculated components are returned.- Returns
NDDataset– Dataset with shape (n_components, n_features)
- inverse_transform(X_transform=None, Y_transform=None, both=False, **kwargs)
Transform data back to its original space.
In other words, return reconstructed
XandYwhose reduce/transform would beX_transformandY_transform.- Parameters
X_transform (array-like of shape (n_observations, n_components), optional) – Reduced
Xdata, wheren_observationsis the number of observations andn_componentsis the number of components. IfX_transformis not provided, a transform ofXprovided infitis performed first.Y_transform (
NDDatasetor array-like of shape (n_observations,n_components), optional) – New data, where n_targets is the number of variables to predict. IfY_transformis not provided, a transform ofYprovided infitis performed first.**kwargs (keyword parameters, optional) – See Other Parameters.
- Returns
NDDataset– Dataset with shape (n_observations, n_features).- Other Parameters
n_components (
int, optional) – The number of components to use for the reduction. If not given the number of components is eventually the one specified or determined in thefitprocess.
See also
reconstructAlias of inverse_transform (Deprecated).
- parameters(replace="params", removed="0.7.1") def parameters(self, default=False)[source]
Alias for
paramsmethod.
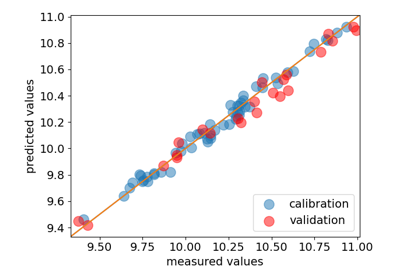
- parityplot(self, Y=None, Y_hat=None, clear=True, **kwargs)[source]
Plot the predicted (\(\hat{Y}\)) vs measured (\(Y\)) values.
\(Y\) and \(\hat{Y}\) can be passed as arguments. If not, the
Yattribute is used for \(Y\)and \(\hat{Y}\)is computed by theinverse_transformmethod.- Parameters
Y (
NDDataset, optional) – Measured values. If is not provided (default), theYattribute is used and Y_hat is computed usinginverse_transform.Y_hat (
NDDataset, optional) – Predicted values. ifYis provided,Y_hatmust also be provided as computed externally.clear (
bool, optional) – Whether to plot on a new axes. Default is True.**kwargs (keyword parameters, optional) – See Other Parameters.
- Returns
Axes– Matplotlib subplot axe.- Other Parameters
s (
floator array-like, shape (n, ), optional) – The marker size in points**2 (typographic points are 1/72 in.). Default is rcParams[‘lines.markersize’] ** 2.c (array-like or
listof colors or color, optional) – The marker colors. Possible values:A scalar or sequence of n numbers to be mapped to colors using cmap and norm.
A 2D array in which the rows are RGB or RGBA.
A sequence of colors of length n.
A single color format string. see
scatterfor details.
marker (
markerMarkerStyle, default: rcParams[“scatter.marker”] (default: ‘o’)) – The marker style. marker can be either an instance of the class or the text shorthand for a particular marker. Seemarkersfor more information.cmap (
strorColormap, default: rcParams[“image.cmap”] (default: ‘viridis’)) – The Colormap instance or registered colormap name used to map scalar data to colors. This parameter is ignored if c is RGB(A).norm (
stror Normalize, optional) – The normalization method used to scale scalar data to the [0, 1] range before mapping to colors using cmap. By default, a linear scaling is used, mapping the lowest value to 0 and the highest to 1. If given, this can be one of the following:An instance of Normalize or one of its subclasses (see Colormap Normalization).
A scale name, i.e. one of “linear”, “log”, “symlog”, “logit”, etc. For a list of available scales, call matplotlib.scale.get_scale_names(). In that case, a suitable Normalize subclass is dynamically generated and instantiated. This parameter is ignored if c is RGB(A).
vmin, vmax (
float, optional) – When using scalar data and no explicit norm, vmin and vmax define the data range that the colormap covers. By default, the colormap covers the complete value range of the supplied data. It is an error to use vmin/vmax when a norm instance is given (but using a str norm name together with vmin/vmax is acceptable). This parameter is ignored if c is RGB(A).alpha (
float, default: 0.5) – The alpha blending value, between 0 (transparent) and 1 (opaque).linewidths (
floator array-like, default: rcParams[“lines.linewidth”] (default: 1.5)) – The linewidth of the marker edges. Note: The default edgecolors is ‘face’. You may want to change this as well.edgecolors ({‘face’, ‘none’, None} or color or sequence of color, default: rcParams[“scatter.edgecolors”], (default: ‘face’)) – The edge color of the marker. Possible values: ‘face’: The edge color will always be the same as the face color. ‘none’: No patch boundary will be drawn. A color or sequence of colors. For non-filled markers, edgecolors is ignored. Instead, the color is determined like with ‘face’, i.e. from c, colors, or facecolors.
plotnonfinite (
bool, default: False) – Whether to plot points with nonfinite c (i.e. inf, -inf or nan). If True the points are drawn with the bad colormap color (see Colormap.set_bad).
- plotmerit(X=None, X_hat=None, **kwargs)[source]
Plot the input (
X), reconstructed (X_hat) and residuals.\(X\) and \(\hat{X}\) can be passed as arguments. If not, the
Xattribute is used for \(X\)and \(\hat{X}\)is computed by theinverse_transformmethod- Parameters
X (
NDDataset, optional) – Original dataset. If is not provided (default), theXattribute is used and X_hat is computed usinginverse_transform.X_hat (
NDDataset, optional) – Inverse transformed dataset. ifXis provided,X_hatmust also be provided as compuyed externally.**kwargs (keyword parameters, optional) – See Other Parameters.
- Returns
Axes– Matplotlib subplot axe.- Other Parameters
colors (
tupleorndarrayof 3 colors, optional) – Colors forX,X_hatand residualsE. in the case of 2D, The default colormap is used forX. By default, the three colors areNBlue,NGreenandNRed(which are colorblind friendly).offset (
float, optional, default:None) – Specify the separation (in percent) between the \(X\) , \(X_hat\) and \(E\).nb_traces (
intor'all', optional) – Number of lines to display. Default is'all'.**others (Other keywords parameters) – Parameters passed to the internal
plotmethod of theXdataset.
- predict(X=None)
Predict targets of given observations.
- Parameters
X (
NDDatasetor array-like of shape (n_observations, n_features), optional) – New data, where n_observations is the number of observations and n_features is the number of features. if not provided, the input dataset of thefitmethod will be used.- Returns
NDDataset– Datasets with shape (n_observations,) or ( n_observations, n_targets).
- reconstruct(X_transform=None, **kwargs)[source]
Transform data back to its original space.
In other words, return an input
X_originalwhose reduce/transform would beX_transform.- Parameters
X_transform (array-like of shape (n_observations, n_components), optional) – Reduced
Xdata, wheren_observationsis the number of observations andn_componentsis the number of components. IfX_transformis not provided, a transform ofXprovided infitis performed first.**kwargs (keyword parameters, optional) – See Other Parameters.
- Returns
NDDataset– Dataset with shape (n_observations, n_features).- Other Parameters
n_components (
int, optional) – The number of components to use for the reduction. If not given the number of components is eventually the one specified or determined in thefitprocess.
See also
reconstructAlias of inverse_transform (Deprecated).
Notes
Deprecated in version 0.6.
- reduce(X=None, **kwargs)[source]
Apply dimensionality reduction to
X.- Parameters
X (
NDDatasetor array-like of shape (n_observations, n_features), optional) – New data, where n_observations is the number of observations and n_features is the number of features. if not provided, the input dataset of thefitmethod will be used.**kwargs (keyword parameters, optional) – See Other Parameters.
- Returns
NDDataset– Dataset with shape (n_observations, n_components).- Other Parameters
n_components (
int, optional) – The number of components to use for the reduction. If not given the number of components is eventually the one specified or determined in thefitprocess.
Notes
Deprecated in version 0.6.
- score(X=None, Y=None, sample_weight=None)[source]
Return the coefficient of determination of the prediction.
The coefficient of determination \(R^2\) is defined as \((1 - \frac{u}{v})\) , where \(u\) is the residual sum of squares
((y_true - y_pred)** 2).sum()and \(v\) is the total sum of squares((y_true - y_true.mean()) ** 2).sum(). The best possible score is1.0and it can be negative (because the model can be arbitrarily worse). A constant model that always predicts the expected value ofY, disregarding the input features, would get a \(R^2\) score of 0.0.- Parameters
X (
NDDatasetor array-like of shape (n_observations, n_features), optional) – Test samples. If not given, the X attribute is used.Y (
NDDatasetor array-like of shape (n_observations, n_targets), optional) – True values forX.sample_weight (
NDDatasetor array-like of shape (n_samples,), default:None) – Sample weights.
- Returns
- transform(X=None, Y=None, both=False, **kwargs)
Apply dimensionality reduction to
XandY.- Parameters
X (
NDDatasetor array-like of shape (n_observations, n_features), optional) – New data, where n_observations is the number of observations and n_features is the number of features. if not provided, the input dataset of thefitmethod will be used.Y (
NDDatasetor array-like of shape (n_observations, n_targets), optional) – New data, where n_targets is the number of variables to predict. if not provided, the input dataset of thefitmethod will be used.both (
bool, default:False) – Whether to also apply the dimensionality reduction to Y when neither X nor Y are provided.**kwargs (keyword parameters, optional) – See Other Parameters.
- Returns
x_score, y_score (
NDDatasetor tuple ofNDDataset) – Datasets with shape (n_observations, n_components).
Examples using spectrochempy.PLSRegression