Note
Go to the end to download the full example code
NDDataset baseline correction
In this example, we perform a baseline correction of a 2D NDDataset
interactively, using the multivariate method and a pchip interpolation.
As usual we start by importing the useful library, and at least the spectrochempy library.
import spectrochempy as scp
Load data:
datadir = scp.preferences.datadir
nd = scp.NDDataset.read_omnic(datadir / "irdata" / "nh4y-activation.spg")
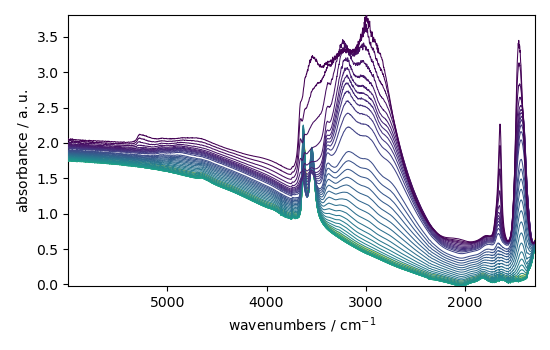
Do some slicing to keep only the interesting region:
Define the BaselineCorrection object:
Launch the interactive view, using the BaselineCorrection.run method:
Print the corrected dataset:
print(ibc.corrected)
_ = ibc.corrected.plot()
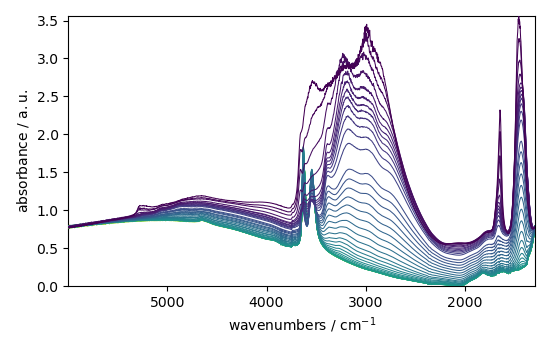
NDDataset: [float64] a.u. (shape: (y:55, x:4883))
This ends the example ! The following line can be uncommented if no plot shows when running the .py script
scp.show()
Total running time of the script: ( 0 minutes 1.827 seconds)