spectrochempy.detrend
- detrend(dataset, order='linear', breakpoints=[], **kwargs)[source]
Remove polynomial trend along a dimension from dataset.
Depending on the ``order``parameter,
detrendremoves the best-fit polynomial line (in the least squares sense) from the data and returns the remaining data.- Parameters
dataset (
NDDataset) – The input data.order (non-negative
intor astramong [‘constant’, ‘linear’, ‘quadratic’, ‘cubic’], optional, default:’linear’) – The order of the polynomial trend.If
order=0or'constant', the mean of data is subtracted to remove a shift trend.If
order=1or'linear'(default), the best straight-fit line is subtracted from data to remove a linear trend (drift).If order=2 or
order=quadratic, the best fitted nth-degree polynomial line is subtracted from data to remove a quadratic polynomial trend.order=ncan also be used to remove any nth-degree polynomial trend.
breakpoints (array_like, optional) – Breakpoints to define piecewise segments of the data, specified as a vector containing coordinate values or indices indicating the location of the breakpoints. Breakpoints are useful when you want to compute separate trends for different segments of the data.
- Returns
NDDataset– The detrended dataset.
See also
BaselineManual baseline correction processor.
get_baselineCompuute a baseline using the
Baselineclass.bascMake a baseline correction using the
Baselineclass.aslsPerform an Asymmetric Least Squares Smoothing baseline correction.
snipPerform a Simple Non-Iterative Peak (SNIP) detection algorithm.
rubberbandPerform a Rubberband baseline correction.
autosubPerform an automatic subtraction of reference.
Examples using spectrochempy.detrend
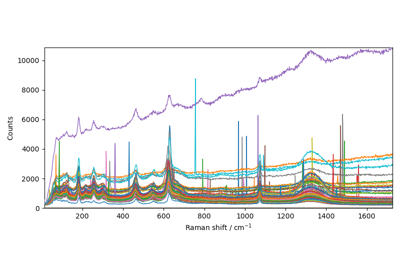
Using plot_multiple to plot several datasets on the same figure