Note
Go to the end to download the full example code
Introduction to the plotting librairie
import spectrochempy as scp
The location of the spectrochempy_data can be found in preferences
Let’s read on of the dataset (in spg Omnnic format)
dataset = scp.NDDataset.read_omnic(datadir / "irdata" / "nh4y-activation.spg")
First we do a generic plot (with the default style):
ax = dataset[0].plot()
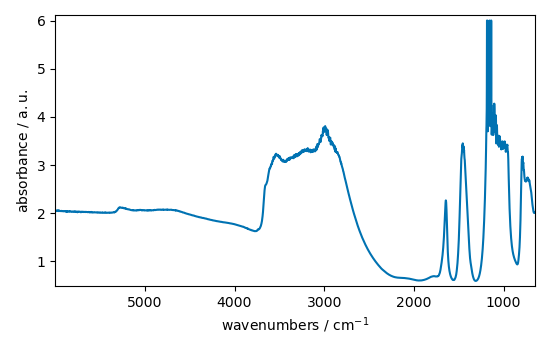
plot generic style
ax = dataset[0].plot(style="classic")
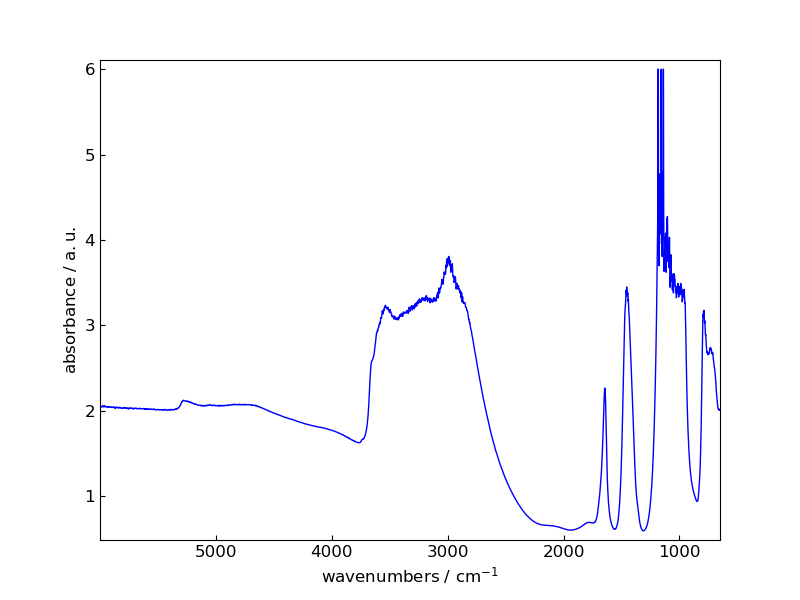
check that style reinit to default should be identical to the first one
ax = dataset[0].plot()

Multiple plots
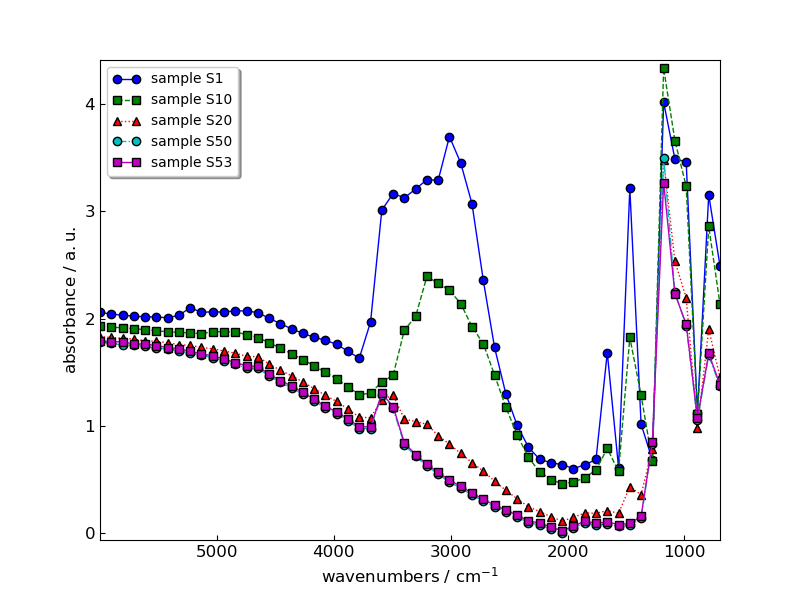
plot multiple with style
_ = scp.plot_multiple(
    method="scatter", style="sans", datasets=datasets, labels=labels, legend="best"
)
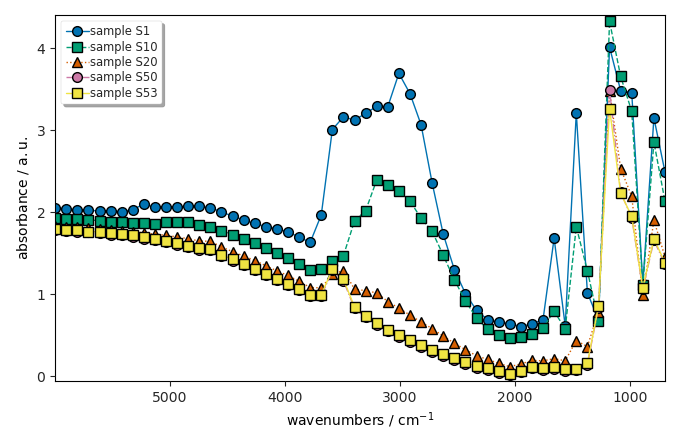
check that style reinit to default
_ = scp.plot_multiple(method="scatter", datasets=datasets, labels=labels, legend="best")

This ends the example ! The following line can be uncommented if no plot shows when running the .py script with python
# scp.show()
Total running time of the script: ( 0 minutes 1.326 seconds)