Note
Go to the end to download the full example code
Denoising a 2D Raman spectrum
In this example, we use the denoise method to remove the noise from a 2D Raman
spectrum.
Import spectrochempy
import spectrochempy as scp

scp.set_loglevel("INFO")  # to see information
Load the data (should be a 2D spectrum or a list of datasets that can be merged):
select the useful region
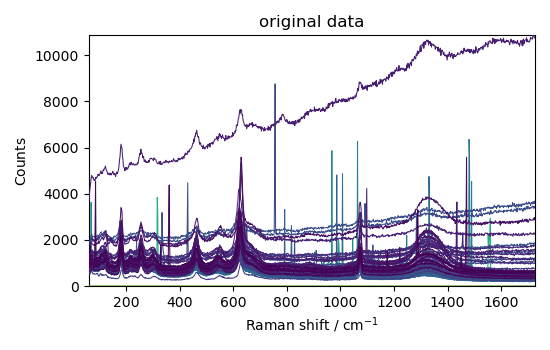
Basic plot
_ = nd.plot(title="original data")
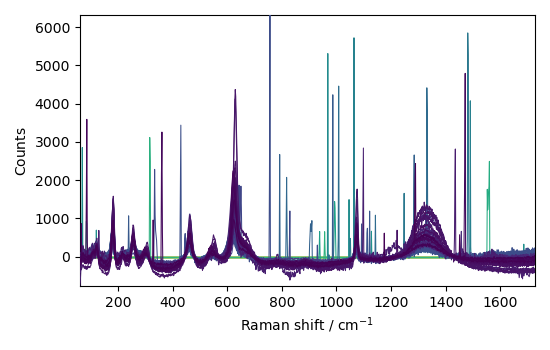
Detrend the data (for a easier comparison)
nd1 = nd.detrend(title="detrended data")
_ = nd1.plot()
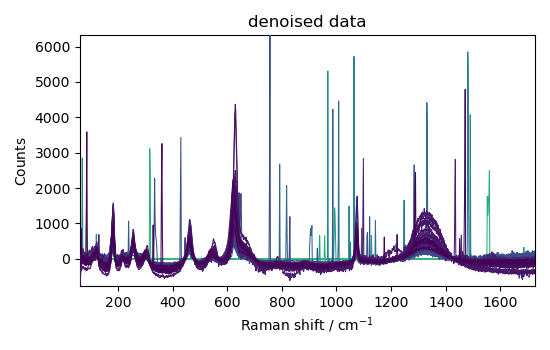
Denoise the data using the denoise method with the default parameters
i.e., ratio=99.8
nd2 = nd1.denoise()
_ = nd2.plot(title="denoised data")
Denoise the data using a different ratio
nd3 = nd1.denoise(ratio=95)
_ = nd3.plot(title="denoised data")


nd4 = nd1.denoise(ratio=90)
_ = nd4.plot(title="denoised data")
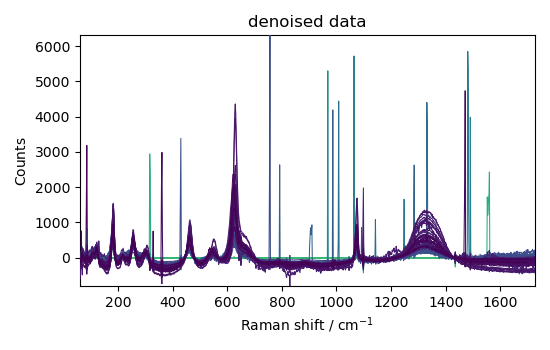
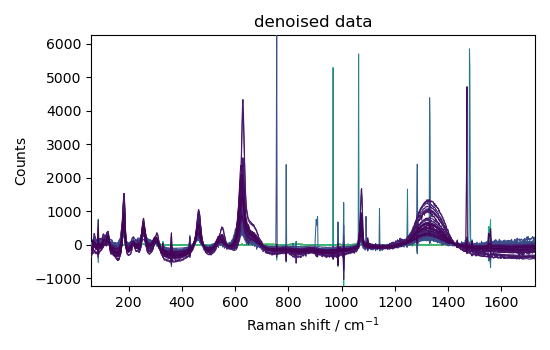
This example shows that denoising can be used effectively on such spectra to increase the signal-to-noise ratio.
However, it apparently has a poor effect on eliminating cosmic ray peaks.
For the latter, it may be useful to use despike methods as seen in another example.
This ends the basic example of denoising a 2D Raman spectrum.
# scp.show() # uncomment to show plot if running from a script
Total running time of the script: ( 0 minutes 1.936 seconds)