
Ctrl+K
SpectroChemPy 1.2.1.dev5 documentation - Home SpectroChemPy 1.2.1.dev5 documentation - Home
    • Installation
    • 5-minute quickstart
    • Getting help
    • Introduction
    • Import and export
    • Processing
    • Analysis and modeling
    • Plotting
    • Plugins
    • Using the API
    • Data objects
    • Contribute / developer guide
    • Public API
    • Plugin API
    • Glossary
    • Datasets and plotting
    • Processing
    • Analysis
    • Plugins
    • Why SpectroChemPy?
    • What's new
    • Papers citing SpectroChemPy
    • Bibliography
    • Citing SpectroChemPy
    • Contributors
    • SpectroChempy License
    • Related projects
  • GitHub
  • PyPI
  • Conda
    • Installation
    • 5-minute quickstart
    • Getting help
    • Introduction
    • Import and export
    • Processing
    • Analysis and modeling
    • Plotting
    • Plugins
    • Using the API
    • Data objects
    • Contribute / developer guide
    • Public API
    • Plugin API
    • Glossary
    • Datasets and plotting
    • Processing
    • Analysis
    • Plugins
    • Why SpectroChemPy?
    • What's new
    • Papers citing SpectroChemPy
    • Bibliography
    • Citing SpectroChemPy
    • Contributors
    • SpectroChempy License
    • Related projects
  • GitHub
  • PyPI
  • Conda

Examples

Examples

  • Datasets and plotting
    • How to use NDDataset
      • NDDataset creation and plotting example
      • NDDataset coordinates example
      • Units manipulation examples
      • Slice an NDDataset with indices and coordinates
    • Interoperability
      • Interoperability with xarray and NetCDF
    • Import / Export
      • Reading datasets
      • Loading an IR (omnic SPG) experimental file
      • Loading Bruker OPUS files
      • Reading a PerkinElmer SP file (plugin)
      • Loading RAMAN experimental file
      • Reading Renishaw WiRE files
      • Reading SPC format files
    • Plotting datasets
      • Using plot_multiple to plot several datasets on the same figure
      • Choose an explicit plot type for a 2D IR dataset
      • Introduction to the plotting library
      • Apply built-in plotting styles
    • Project Management
      • Project creation
  • Processing
    • Baseline
      • NDDataset baseline correction
    • Denoising
      • Denoising a 2D Raman spectrum
      • Removing cosmic ray spikes from a Raman spectrum
    • Filtering
      • Savitky-Golay and Whittaker-Eilers smoothing of a Raman spectrum
      • Savitzky-Golay derivatives on a synthetic spectrum
      • Compare smoothing window sizes on a Raman spectrum
    • Processing Raman datasets
      • Processing RAMAN spectra
    • Transformations
      • Mask a saturated region and transform an IR dataset
      • Chemometric preprocessing
      • Preprocessing transformers and scikit-learn compatibility
  • Analysis
    • Decomposition
      • EFA example
      • EFA (Keller and Massart original example)
      • FastICA example
      • IRIS: 2D-IRIS analysis (plugin)
      • MCR-ALS example (adapted from Jaumot et al. 2005)
      • MCR-ALS with kinetic constraints
      • NMF analysis example
      • PCA example (iris dataset)
      • PCA analysis example
      • SIMPLISMA example
      • Build synthetic concentration profiles
    • Cross-decomposition
      • Cross-validation of corn moisture models
      • PLS regression example
      • PLS regression with a Pipeline
    • Curvefitting
      • Fitting 1D dataset
      • Fit overlapping peaks in a 2D spectrum
      • Built-in line-shape helpers
      • Solve a linear equation using LSTSQ
    • Peak analysis
      • Explore an IR activation series with Noda’s 2D-COS
      • Find peak maxima in an IR time series
      • Find peaks in an experimental 2D-IR spectrum
      • Integrate a baseline-corrected IR band
      • Integrate a 2D peak and estimate its uncertainty
  • Plugins
  • Examples
  • Processing NDDataset
  • Filtering

Filtering#

This section contains examples of how to filter NDDatasets.
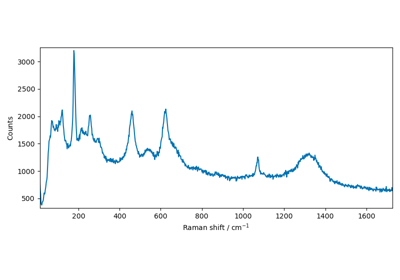
Savitky-Golay and Whittaker-Eilers smoothing of a Raman spectrum

Savitky-Golay and Whittaker-Eilers smoothing of a Raman spectrum
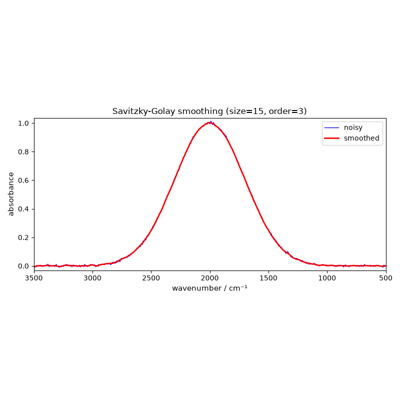
Savitzky-Golay derivatives on a synthetic spectrum

Savitzky-Golay derivatives on a synthetic spectrum
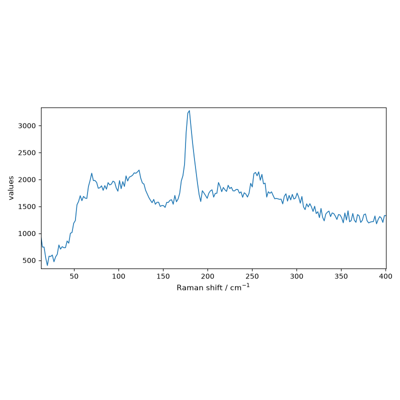
Compare smoothing window sizes on a Raman spectrum

Compare smoothing window sizes on a Raman spectrum

previous

Removing cosmic ray spikes from a Raman spectrum

next

Savitky-Golay and Whittaker-Eilers smoothing of a Raman spectrum

Edit on GitHub

© Copyright 2014-2026 Laboratoire Catalyse et Spectrochimie (LCS) — CeCILL-B license.

Built with the PyData Sphinx Theme 0.17.1.