Skip to main content
Back to top
Ctrl
+
K
1.2.1dev
Getting started
Installation
5-minute quickstart
Getting help
Guides
Introduction
Import and export
Processing
Analysis and modeling
Plotting
Plugins
Using the API
Data objects
Contribute / developer guide
API
Public API
Plugin API
Glossary
Examples
Datasets and plotting
Processing
Analysis
Plugins
About
Why SpectroChemPy?
What's new
Papers citing SpectroChemPy
Bibliography
Citing SpectroChemPy
Contributors
SpectroChempy License
Related projects
Search
Ctrl
+
K
GitHub
PyPI
Conda
Search
Ctrl
+
K
Getting started
Installation
5-minute quickstart
Getting help
Guides
Introduction
Import and export
Processing
Analysis and modeling
Plotting
Plugins
Using the API
Data objects
Contribute / developer guide
API
Public API
Plugin API
Glossary
Examples
Datasets and plotting
Processing
Analysis
Plugins
About
Why SpectroChemPy?
What's new
Papers citing SpectroChemPy
Bibliography
Citing SpectroChemPy
Contributors
SpectroChempy License
Related projects
GitHub
PyPI
Conda
Collapse Sidebar
Expand Sidebar
Examples
Examples
Datasets and plotting
How to use NDDataset
NDDataset creation and plotting example
NDDataset coordinates example
Units manipulation examples
Slice an NDDataset with indices and coordinates
Interoperability
Interoperability with xarray and NetCDF
Import / Export
Reading datasets
Loading an IR (omnic SPG) experimental file
Loading Bruker OPUS files
Reading a PerkinElmer SP file (plugin)
Loading RAMAN experimental file
Reading Renishaw WiRE files
Reading SPC format files
Plotting datasets
Using
plot_multiple
to plot several datasets on the same figure
Choose an explicit plot type for a 2D IR dataset
Introduction to the plotting library
Apply built-in plotting styles
Project Management
Project creation
Processing
Baseline
NDDataset baseline correction
Denoising
Denoising a 2D Raman spectrum
Removing cosmic ray spikes from a Raman spectrum
Filtering
Savitky-Golay and Whittaker-Eilers smoothing of a Raman spectrum
Savitzky-Golay derivatives on a synthetic spectrum
Compare smoothing window sizes on a Raman spectrum
Processing Raman datasets
Processing RAMAN spectra
Transformations
Mask a saturated region and transform an IR dataset
Chemometric preprocessing
Preprocessing transformers and scikit-learn compatibility
Analysis
Decomposition
EFA example
EFA (Keller and Massart original example)
FastICA example
IRIS: 2D-IRIS analysis (plugin)
MCR-ALS example (adapted from Jaumot et al. 2005)
MCR-ALS with kinetic constraints
NMF analysis example
PCA example (iris dataset)
PCA analysis example
SIMPLISMA example
Build synthetic concentration profiles
Cross-decomposition
Cross-validation of corn moisture models
PLS regression example
PLS regression with a Pipeline
Curvefitting
Fitting 1D dataset
Fit overlapping peaks in a 2D spectrum
Built-in line-shape helpers
Solve a linear equation using LSTSQ
Peak analysis
Explore an IR activation series with Noda’s 2D-COS
Find peak maxima in an IR time series
Find peaks in an experimental 2D-IR spectrum
Integrate a baseline-corrected IR band
Integrate a 2D peak and estimate its uncertainty
Plugins
Examples
Processing NDDataset
Processing Raman datasets
Processing Raman datasets
#
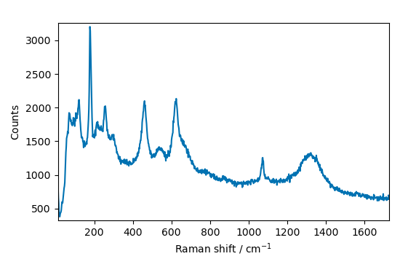
Processing RAMAN spectra
Processing RAMAN spectra
Edit on GitHub