Note
Go to the end to download the full example code
Savitky-Golay and Whittaker-Eilers smoothing of a Raman spectrum
In this example, we use the Filter processor to smooth a Raman spectrum.
import spectrochempy as scp
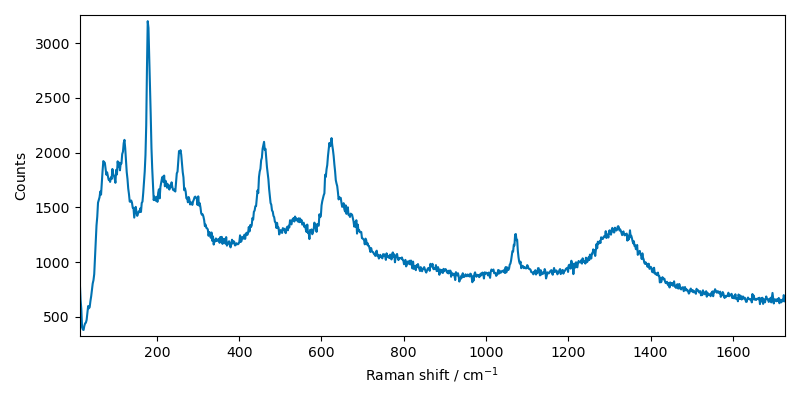
First, we import a sample raman spectrum and plot it:
# use the generic read function.
# Note that read_labspec would be equivalent for this file format.

X = scp.read("ramandata/labspec/SMC1-Initial_RT.txt")
prefs = X.preferences
prefs.figure.figsize = (8, 4)
_ = X.plot()
here Filter processor is used to apply a Savitzky-Golay filter to the
spectrum.
filter = scp.Filter(
    method="savgol", size=5, order=0
)  # default is size=5, order=2, deriv=0

# plot the result
Xm = filter(X)
_ = X.plot(color="b", label="original")
ax = Xm.plot(clear=False, color="r", ls="-", lw=1.5, label="SG filter")
diff = X - Xm
s = round(diff.std(dim=-1).values, 2)
ax = diff.plot(clear=False, ls="-", lw=1, label=f"difference (std={s})")
ax.legend(loc="best", fontsize=10)
ax.set_title("Savitzky-Golay filter (size=7, order=2)")
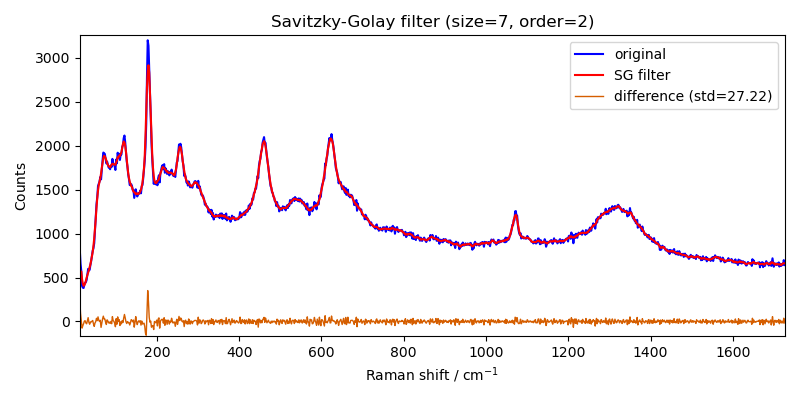
Text(0.5, 1.0, 'Savitzky-Golay filter (size=7, order=2)')
As good alternative to the Savitzky-Golay filter want can choose to use the Whittaker-Eilers smoother
filter = scp.Filter(method="whittaker", order=2, lamb=1.5)
Xm = filter(X)
# plot the result
Xm = filter(X)
_ = X.plot(color="b", label="original")
ax = Xm.plot(clear=False, color="r", ls="-", lw=1.5, label="WE filter")
diff = X - Xm
s = round(diff.std(dim=-1).values, 2)
ax = diff.plot(clear=False, ls="-", lw=1, label=f"difference (std={s})")
ax.legend(loc="best", fontsize=10)
ax.set_title("Whittaker-Eiler filter (order=2, lamb=1.5)")
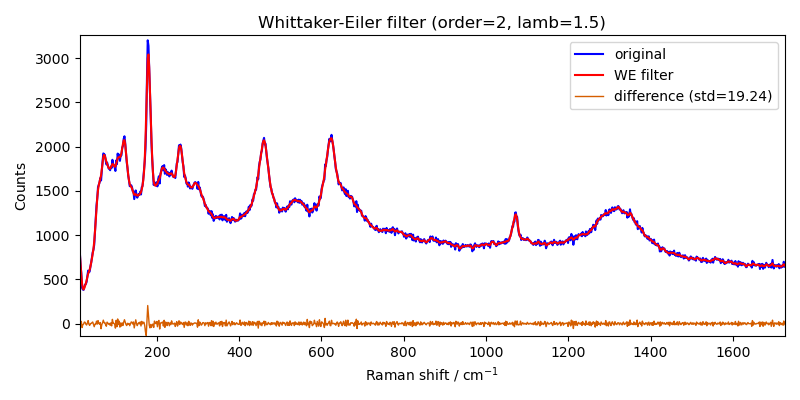
Text(0.5, 1.0, 'Whittaker-Eiler filter (order=2, lamb=1.5)')
Total running time of the script: ( 0 minutes 0.595 seconds)