Note
Go to the end to download the full example code
Processing Relaxation measurement
Processing NMR spectra taken for relaxation measurements
Import API
import spectrochempy as scp

# short version of the unit registry
U = scp.ur
Importing a pseudo 2D NMR spectra
Define the folder where are the spectra
datadir = scp.preferences.datadir
nmrdir = datadir / "nmrdata" / "bruker" / "tests" / "nmr"

dataset = scp.read_topspin(nmrdir / "relax" / "100" / "ser", use_list="vdlist")
Analysing the data
Print dataset summary
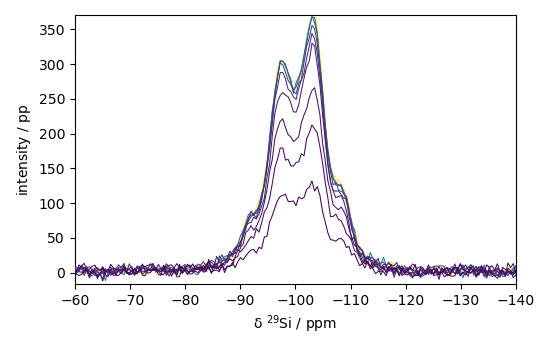
Plot the dataset

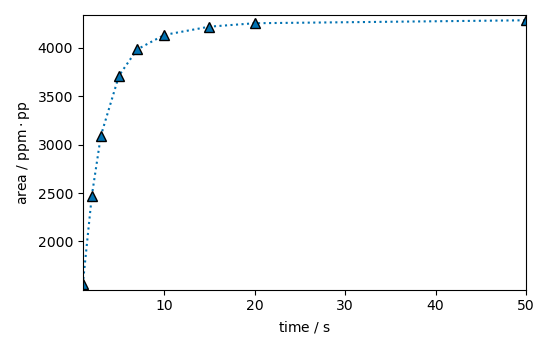
Integrate a region
dsint = ds[:, -90.0:-115.0].simpson()
_ = dsint.plot(marker="^", ls=":")
dsint.real

/home/runner/micromamba/envs/scpy_docs/lib/python3.10/site-packages/spectrochempy/analysis/integration/integrate.py:178: DeprecationWarning: 'scipy.integrate.simps' is deprecated in favour of 'scipy.integrate.simpson' and will be removed in SciPy 1.14.0
  return scipy.integrate.simps(dataset.data, **kwargs)
Fit a model
create an Optimize object using a simple leastsq method
fitter = scp.Optimize(log_level="INFO", method="leastsq")
Define the model to fit
def T1_model(t, I0, T1):  # no underscore in parameters names.
    # T1 relaxation model
    import numpy as np

    I = I0 * (1 - np.exp(-t / T1))
    return I
Add the model to the fitter usermodels as it it not a built-in model
fitter.usermodels = {"T1_model": T1_model}
Define the parameter variables using a script (parameter: value, low_bound, high_bound) no underscore in parameters names.
fitter.script = """
MODEL: T1
shape: T1_model
  $ I0:  1000.0, 1, none
  $ T1:  2.0,    0.1, none
"""
Performs the fit
_ = fitter.fit(dsint)
som = fitter.predict()
som
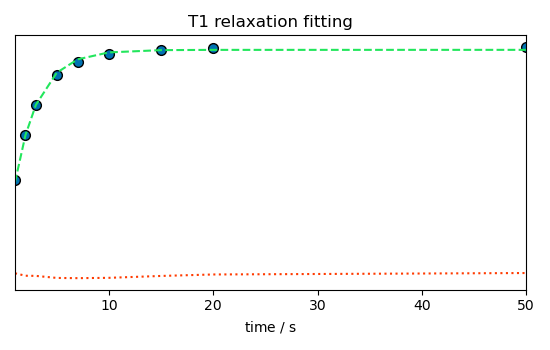
_ = fitter.plotmerit(dsint, som, method="scatter", title="T1 relaxation fitting")

This ends the example ! The following line can be removed or commented when the example is run as a notebook (*.ipynb).
# scp.show()
Total running time of the script: ( 0 minutes 0.539 seconds)