Note
Go to the end to download the full example code.
PLS regression example
In this example, we perform a PLS regression to predict the moisture of corn samples from their NIR spectra.
Import the package
import spectrochempy as scp
Load the corn NIR dataset
The data is available from the Eigenvector archive:
try:
    ds_list = scp.read("http://www.eigenvector.com/data/Corn/corn.mat", merge=False)
except FileNotFoundError:
    ds_list = None
    print("Eigenvector corn dataset not reachable; skipping the remote PLS example.")
else:
    ds_list_names = [f"{i} : {ds.name}({ds.shape})" for i, ds in enumerate(ds_list)]
    print(ds_list_names)
['0 : m5nbs((3, 700))', '1 : mp5nbs((4, 700))', '2 : mp6nbs((4, 700))', '3 : propvals((80, 4))', '4 : m5spec((80, 700))', '5 : mp5spec((80, 700))', '6 : mp6spec((80, 700))']
if ds_list is not None:
# %%
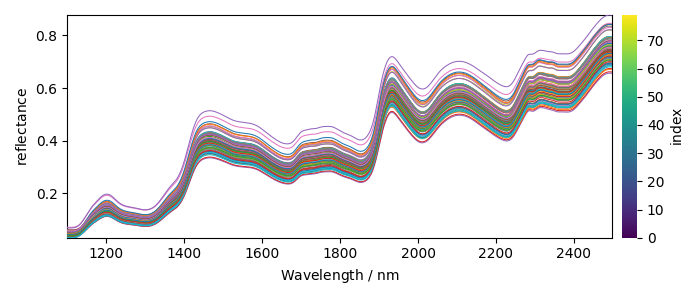
# Inspect the spectra
# ^^^^^^^^^^^^^^^^^^^^
# The 5th dataset ``m5spec`` contains NIR spectra from 80 corn samples
# recorded on the same instrument:
X = ds_list[4]
X.title = "reflectance"
X.x.title = "Wavelength"
X.x.units = "nm"
_ = X.plot(cmap=None)
# %%
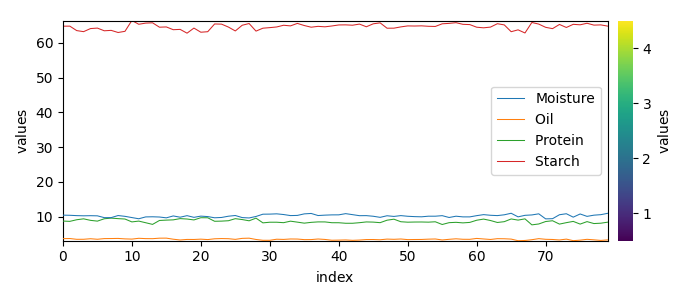
# The properties to predict are in the ``propval`` dataset:
Y = ds_list[3]
_ = Y.T.plot(cmap=None, legend=Y.x.labels)
# %%
# Predict moisture content
# ^^^^^^^^^^^^^^^^^^^^^^^^
y = Y[:, "Moisture"]
# %%
# Split into training and test sets
# ^^^^^^^^^^^^^^^^^^^^^^^^^^^^^^^^^^
# Use 57 samples (2/3) for calibration and the rest for validation:
X_train = X[:57]
X_test = X[57:]
y_train = y[:57]
y_test = y[57:]
# %%
# Fit the PLS model
# ^^^^^^^^^^^^^^^^^^
pls = scp.PLSRegression(n_components=5)
_ = pls.fit(X_train, y_train)
# %%
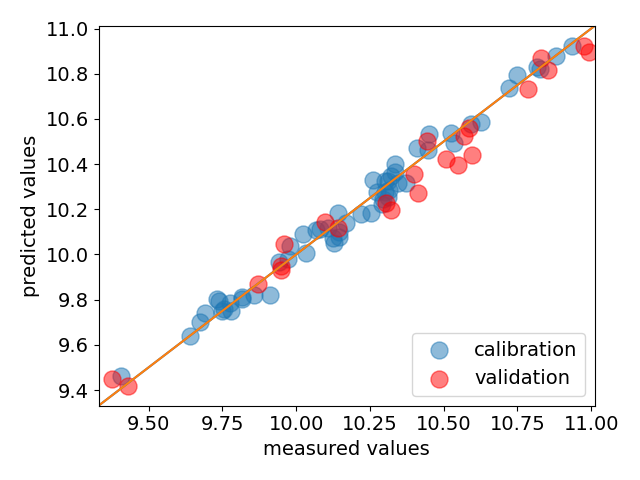
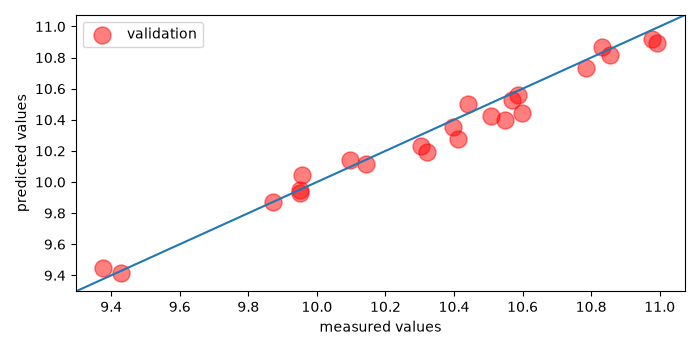
# Validate with a parity plot
# ^^^^^^^^^^^^^^^^^^^^^^^^^^^^
ax = pls.plot_parity(label="calibration", s=150)
_ = pls.plot_parity(
y_test, pls.predict(X_test), s=150, c="red", label="validation", clear=False
)
ax.legend(loc="lower right")
This ends the example ! The following line can be uncommented if no plot shows when running the .py script with python
scp.show()
Total running time of the script: (0 minutes 1.516 seconds)