Loading RAMAN experimental file

Here we load experimental LABSPEC spectra and plot them.

import spectrochempy as scp

Define the folder where are the spectra:

datadir = scp.preferences.datadir
ramandir = datadir / "ramandata/labspec"

Read some data:

A = scp.read_labspec("Activation.txt", directory=ramandir)
A
NDDataset: [float64] unitless (shape: (y:532, x:1024))[Activation]
Summary
name
:
Activation
author
:
runner@pkrvmxyh4eaekms
created
:
2025-06-15 01:53:10+00:00
description
:
Spectrum acquisition : 2016-05-01 11:22:14
history
:
2025-06-15 01:53:10+00:00> Imported from LabSpec6 text file
/home/runner/.spectrochempy/testdata/ramandata/labspec/Activation.txt
Data
title
:
Counts
values
:
...
[[3.277e+05 3.278e+05 ... 7.594e+05 7.607e+05]
[3.239e+05 3.252e+05 ... 7.513e+05 7.501e+05]
...
[5.711e+04 5.69e+04 ... 9.721e+04 9.697e+04]
[ 3831 3826 ... 6476 6385]]
shape
:
(y:532, x:1024)
Dimension `x`
size
:
1024
title
:
Raman shift
coordinates
:
[ 198.2 199.8 ... 1692 1693] cm⁻¹
Dimension `y`
size
:
532
title
:
Time
coordinates
:
[ 0 308.4 ... 1.689e+05 1.692e+05] s
labels
:
[ 2016-05-01 11:22:14 2016-05-01 11:27:14 ... 2016-05-03 07:32:14 2016-05-03 07:37:14]


Now plot them:

plot read raman from labspec


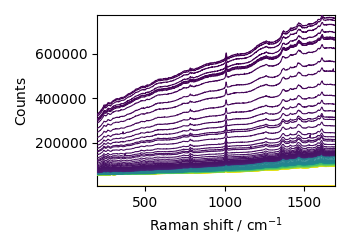
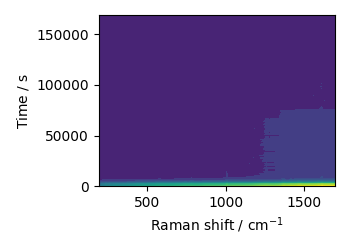
As it is a 2D dataset, we can plot it as an image:
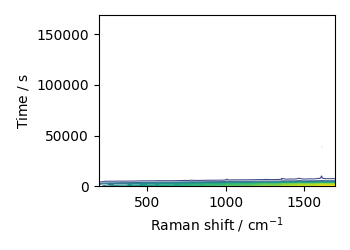
A.plot_image()
plot read raman from labspec


or a contour plot:

A.plot_map()
plot read raman from labspec


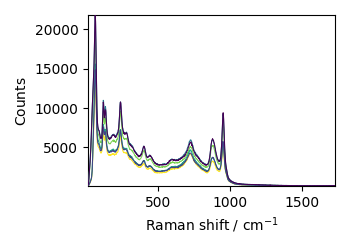
We can also read the content of a folder, and merge all spectra:

plot read raman from labspec


This ends the example ! The following line can be uncommented if no plot shows when running the .py script with python

# scp.show()

Total running time of the script: (0 minutes 5.372 seconds)