Note
Go to the end to download the full example code.
Units manipulation examples
In this example, we show how units can be used in SpectroChemPy
import spectrochempy as scp
SpectroChemPy can do calculations with units. It uses [pint](https://pint.readthedocs.io) to define and perform operations on data with units.
Create quantities
To create quantity, use for instance, one of the following expression:
scp.Quantity("10.0 cm^-1")

""
scp.Quantity(1.0, "cm^-1/hour")
Or, more simply, using ur:
ur = scp.ur
10.0 * ur.meter / ur.gram / ur.volt
ur stands for unit registry, which handles many types of units
and conversions between them.
Units for dataset
When loading experimental dataset using the read method, units are generally attributed to coordinates and data
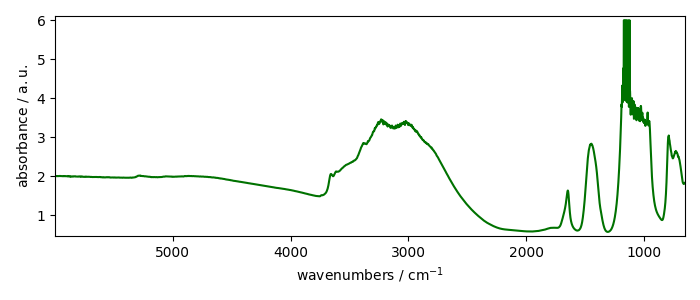
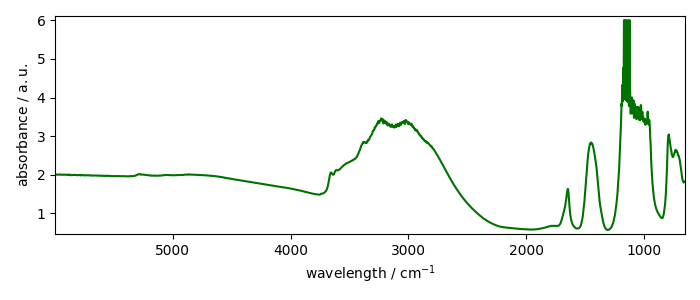
wavenumbers(x) coordinates are here expressed in $cm^{-1}$and
dataare in absorbance ($a.u.$) units.
Convert between units
Here are some examples
x = 36 * ur("km/hr")
x.to("cm/s")
We can make the conversion inplace using ito instead of to
x.ito("m/s")
x
Obviously you cannot convert between incompatible units
try:
    x.to("hour")
except Exception as e:
    print(f"Expected incompatible-unit conversion error: {e}")
Expected incompatible-unit conversion error: Cannot convert from 'meter / second' ([length] / [time]) to 'hour' ([time])
This, of course, also applies to NDDataset.
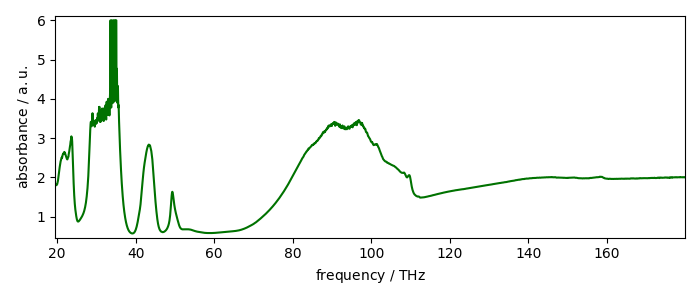
Let’s try for the x coordinate. It is a wavenumber in $cm^{-1}$ that
can be transformed to $Hz$, for instance:
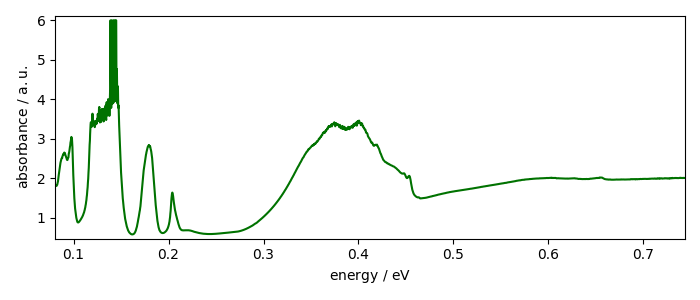
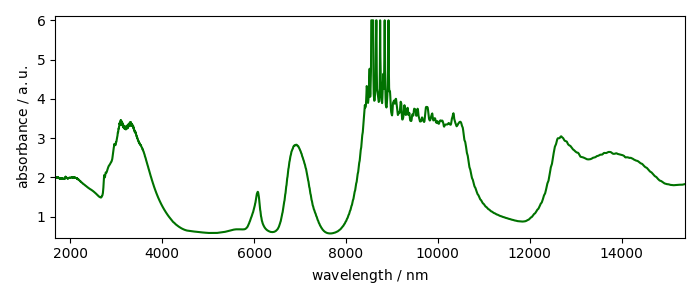
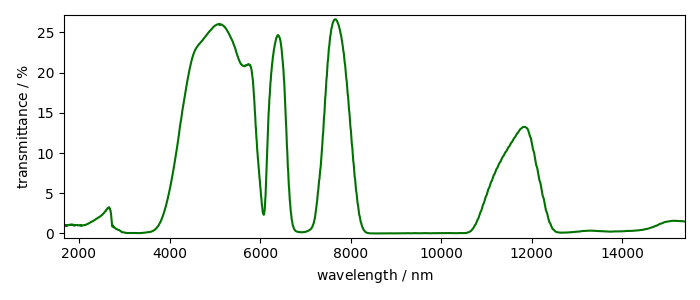
We can also change wavenumber or frequency units to energy or wavelength, as SpectroChemPy, thanks to [pint](https://pint.readthedocs.io), knows how to make the transformation.
absorbance units (the units of the data)
can also be transformed into transmittance
Back to absorbance.
This ends the example ! The following line can be uncommented if no plot shows when running the .py script with python
# scp.show()
Total running time of the script: (0 minutes 0.770 seconds)