Alignment of datasets
[1]:
import spectrochempy as scp
Example
To allow some mathematical operations or dataset processing, it is often necessary that the datasets are aligned, i.e., that they have compatible coordinate for the dimensions.
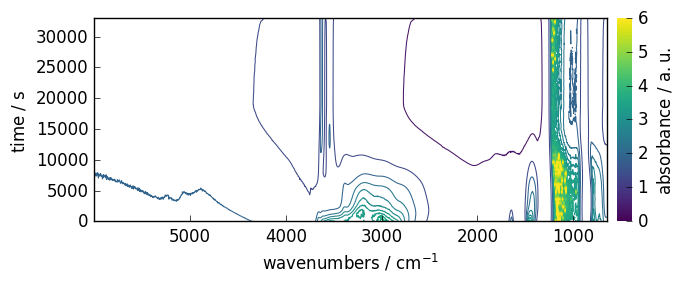
For sake of demonstration, let’s take an experimental dataset that will be arbitrary split into four unaligned datasets. Then will realign them and apply some binary mathematical operation such as addition or subtraction that required aligned coordinates.
[2]:
dataset = scp.read_omnic("irdata/nh4y-activation.spg")
dataset.y = dataset.y - dataset.y[0]  # remove offset in the time
dataset.y.title = "time"
prefs = scp.preferences
prefs.reset()
prefs.figure.figsize = (7, 3)
prefs.figure.dpi = 100
dataset.plot_map(colormap="viridis", colorbar=True)
print("shape:", dataset.shape)
shape: (55, 5549)
[3]:
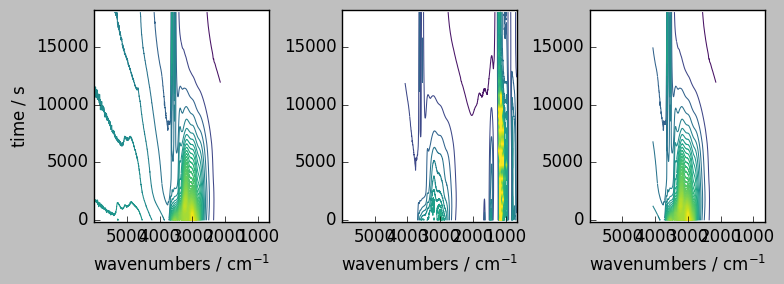
nd1 = dataset[0:30, 0:4000]
nd2 = dataset[0:30, 2000:5549]
nd3 = dataset[10:55, 0:4000]
nd4 = dataset[10:55, 2000:5549]
_ = scp.multiplot_contour(
    datasets=[nd1, nd2, nd3, nd4],
    colormap="viridis",
    nrow=2,
    ncol=2,
    sharex=True,
    sharey=True,
    dpi=100,
)
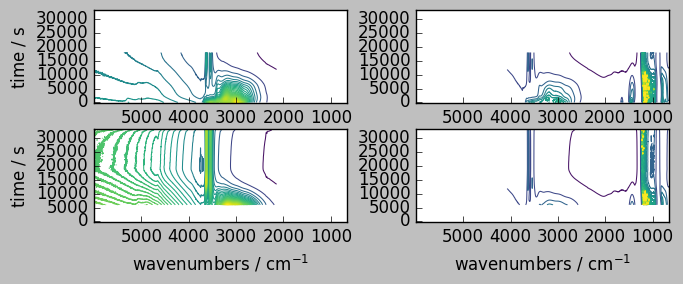
The four datasets nd1 to nd4 have some overlapping in both dimensions. But if we want for example to add nd2 with nd4 . This will fail because the dimension are not aligned.
[4]:
try:
    nd2 + nd4
except Exception as e:
    scp.error_(Exception, str(e) + " Cannot add unaligned datasets.")
ERROR | Exception: operands could not be broadcast together with shapes (30,3549) (45,3549) Cannot add unaligned datasets.
Let try to align them, in the y dimension (i.e. the first) as this the one which differ in size. (NOTE: to find the actual names of the dimensions, just get the dims attribute of the datasets).
[5]:
nd2.dims, nd4.dims
[5]:
(['y', 'x'], ['y', 'x'])
To align we can use different methods, depending on the expected results (missing values in the aligned datasets will be masked)
[6]:
# `outer` method => union of the coordinates
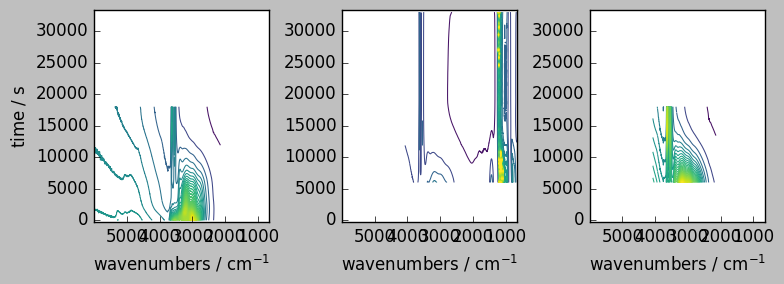
nd2a, nd4a = scp.align(nd2, nd4, dim="y", method="outer")
Now we can perform an addition without any problem
[7]:
ndadd = nd2a + nd4a
ndadd.shape
[7]:
(55, 3549)
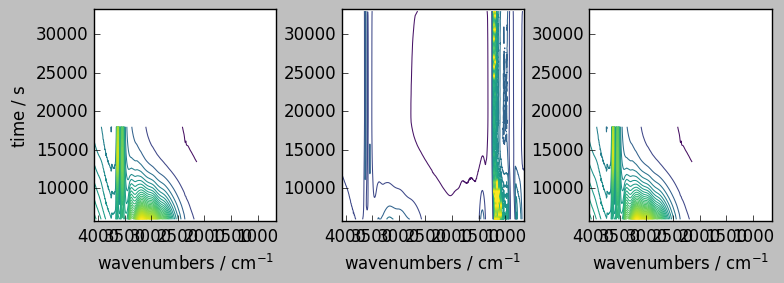
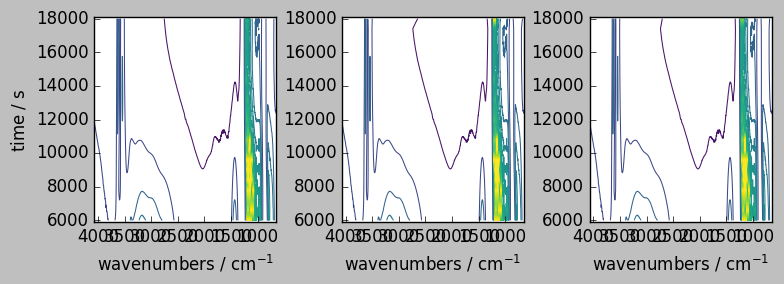
Let’s plot both individual aligned arrays, and their sum. Note, that only the common region appears in the result array, as the mathematical operation are aware of the masks.
[8]:
_ = scp.multiplot_contour(
    datasets=[nd2a, nd4a, ndadd],
    colormap="viridis",
    sharey=True,
    nrow=1,
    ncol=3,
    figsize=(8, 3),
    dpi=100,
)
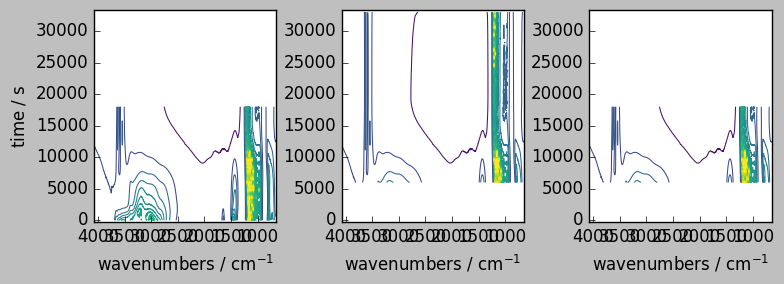
Now, assume we want to align in the other dimension, or both
[9]:
try:
    nd1 + nd2
except Exception as e:
    scp.error_(Exception, str(e) + " Cannot add unaligned datasets.")
ERROR | Exception: Coordinates [[ 6000 5999 ... 2144 2144]] and [[ 4071 4070 ... 650.9 649.9]] mismatch. Cannot add unaligned datasets.
[10]:
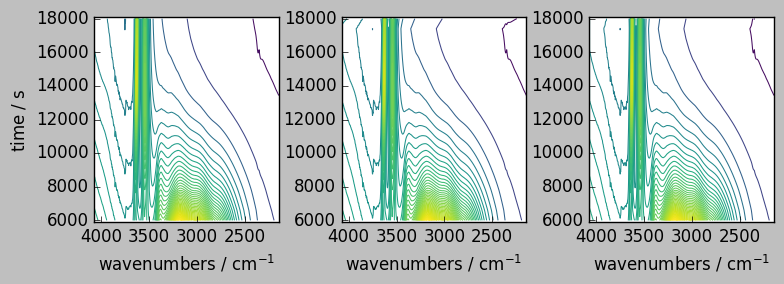
nd1a, nd2a = scp.align(nd1, nd2, dim="x", method="outer")
ndadd = nd1a + nd2a
_ = scp.multiplot_contour(
    datasets=[nd1a, nd2a, ndadd],
    colormap="viridis",
    sharey=True,
    nrow=1,
    ncol=3,
    figsize=(8, 3),
    dpi=100,
)
ndadd.shape
[10]:
(30, 5553)
Methods for alignments
Method for alignments are:
outer which means that a union of the different coordinates is achieved (missing values are masked)
inner which means that the intersection of the coordinates is used
first which means that the first dataset is used as reference
last which means that the last dataset is used as reference
interpolate means that interpolation is performed to handle missing points whenever it is possible (Not yet implemented)
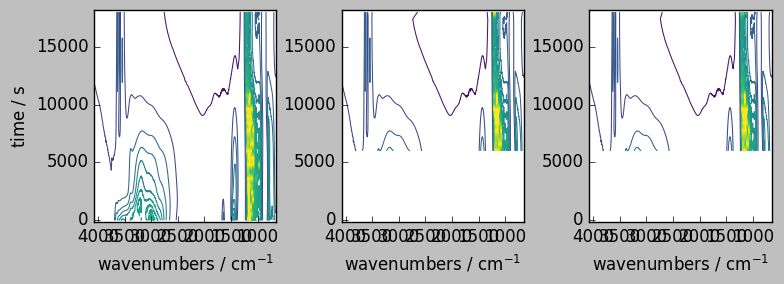
inner method
[11]:
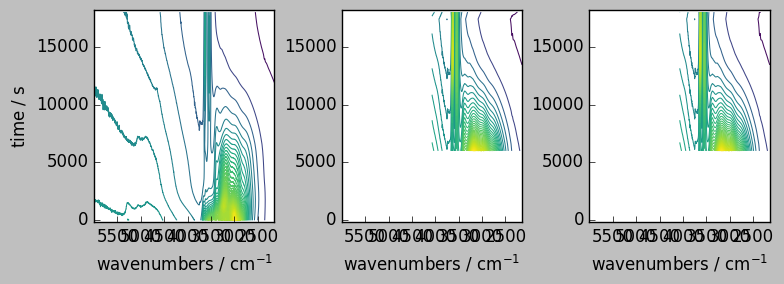
# `inner` method => intersection of the coordinates
nd2a, nd4a = scp.align(nd2, nd4, dim="y", method="inner")
ndadd = nd2a + nd4a
ndadd.shape  # note the difference with the outer method above (the shape correspond to the intersection)
[11]:
(20, 3549)
[12]:
_ = scp.multiplot_contour(
    datasets=[nd2a, nd4a, ndadd],
    colormap="viridis",
    sharey=True,
    nrow=1,
    ncol=3,
    figsize=(8, 3),
    dpi=100,
)
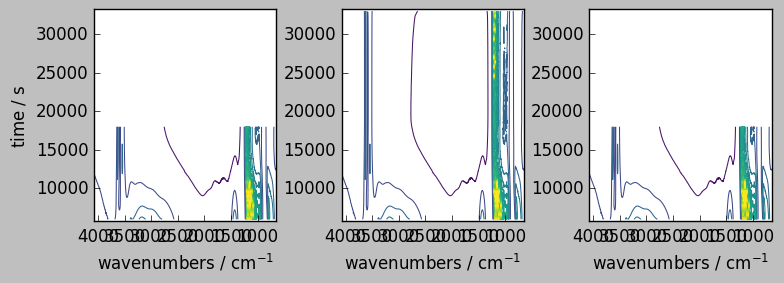
first method
[13]:
# `inner` method => align on the first dataset
nd2a, nd4a = scp.align(nd2, nd4, dim="y", method="first")
ndadd = nd2a + nd4a
ndadd.shape  # note the difference with the outer method above
[13]:
(30, 3549)
[14]:
_ = scp.multiplot_contour(
    datasets=[nd2a, nd4a, ndadd],
    colormap="viridis",
    sharey=True,
    nrow=1,
    ncol=3,
    figsize=(8, 3),
    dpi=100,
)
last method
[15]:
# `last` method => align on the last dataset
nd2a, nd4a = scp.align(nd2, nd4, dim="y", method="last")
ndadd = nd2a + nd4a
ndadd.shape  # note the difference with the outer method above
[15]:
(45, 3549)
[16]:
_ = scp.multiplot_contour(
    datasets=[nd2a, nd4a, ndadd],
    colormap="viridis",
    sharey=True,
    nrow=1,
    ncol=3,
    figsize=(8, 3),
    dpi=100,
)
Alignment along several dimensions
[17]:
nd1a, nd4a = scp.align(nd1, nd4, dims=["y", "x"])  # by default the outer method is used
ndadd = nd1a + nd4a
# Comparison of the result array with the original (only the common region is visible, due to the masks)
_ = scp.multiplot_contour(
    datasets=[nd1a, nd4a, ndadd],
    colormap="viridis",
    sharex=0,
    sharey=True,
    nrow=1,
    ncol=3,
    figsize=(8, 3),
    dpi=100,
)
nd1a.shape, nd4a.shape, ndadd.shape
[17]:
((55, 5553), (55, 5553), (55, 5553))
[18]:
nd1a, nd4a = scp.align(
    nd1, nd4, dims=["y", "x"], method="inner"
)  # by default the outer method is used
ndadd = nd1a + nd4a
# Comparison of the result array with the original (only the common region is visible, due to the masks)
_ = scp.multiplot_contour(
    datasets=[nd1a, nd4a, ndadd],
    colormap="viridis",
    sharex=0,
    sharey=True,
    nrow=1,
    ncol=3,
    figsize=(8, 3),
    dpi=100,
)
[19]:
nd1a, nd4a = scp.align(
    nd1, nd4, dims=["y", "x"], method="first"
)  # by default the outer method is used
ndadd = nd1a + nd4a
# Comparison of the result array with the original (only the common region is visible, due to the masks)
_ = scp.multiplot_contour(
    datasets=[nd1a, nd4a, ndadd],
    colormap="viridis",
    sharex=0,
    sharey=True,
    nrow=1,
    ncol=3,
    figsize=(8, 3),
    dpi=100,
)
[20]:
nd1a, nd4a = scp.align(
    nd1, nd4, dims=["y", "x"], method="last"
)  # by default the outer method is used
ndadd = nd1a + nd4a
# Comparison of the result array with the original (only the common region is visible, due to the masks)
_ = scp.multiplot_contour(
    datasets=[nd1a, nd4a, ndadd],
    colormap="viridis",
    sharex=0,
    sharey=True,
    nrow=1,
    ncol=3,
    figsize=(8, 3),
    dpi=100,
)