Note
Go to the end to download the full example code.
Loading an IR (omnic SPG) experimental file
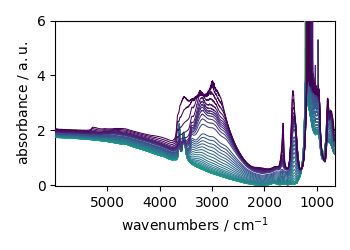
Here we load an experimental SPG file (OMNIC) and plot it.
import spectrochempy as scp
Loading and stacked plot of the original
datadir = scp.preferences.datadir
dataset = scp.read_omnic(datadir / "irdata" / "nh4y-activation.spg")
_ = dataset.plot_stack(style="paper")
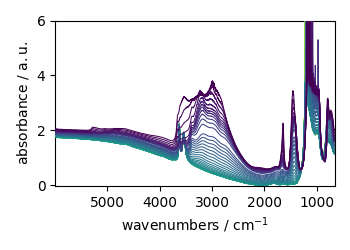
change the unit of y-axis, the y origin as well as the title of the axis
dataset.y.to("hour")
dataset.y -= dataset.y[0]
dataset.y.title = "acquisition time"

_ = dataset.plot_stack()
This ends the example ! The following line can be uncommented if no plot shows when running the .py script with python
# scp.show()
Total running time of the script: (0 minutes 0.408 seconds)