Note
Go to the end to download the full example code.
FastICA example
Import the spectrochempy API package
import spectrochempy as scp
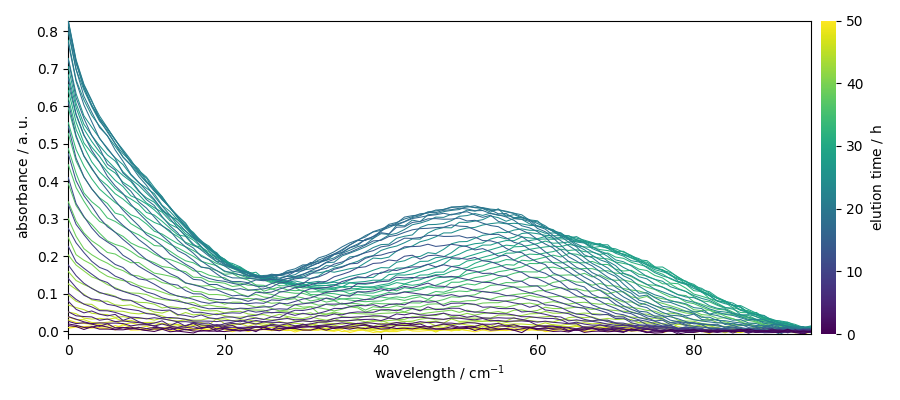
Independent component analysis (ICA) is a computational method for separating a multivariate signal such as spectra into additive components. This is done by assuming that at most one subcomponent is Gaussian and that the components are statistically independents from each other.
# Load, prepare and plot the dataset
# ----------------------------------
# Here we use a dataset from :cite:t:`jaumot:2005`

X = scp.read("matlabdata/als2004dataset.MAT")[-1]

X.title = "absorbance"
X.units = "absorbance"
X.y = scp.Coord.arange(
    X.shape[0], dtype="float", title="elution time"
)  # floats to trigger sequential colormap
X.y.units = "min"
X.x.title = "wavelength"
_ = X.plot()
Create and fit a FastICA object
As argument of the object constructor we define log_level to "INFO" to
obtain verbose output during fit, and we set the number of component to use at 4.
ica = scp.FastICA(n_components=4, log_level="INFO")
_ = ica.fit(X)
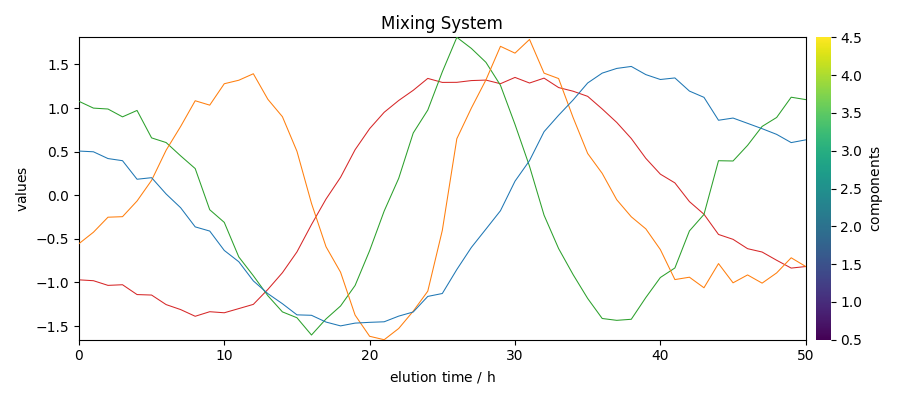
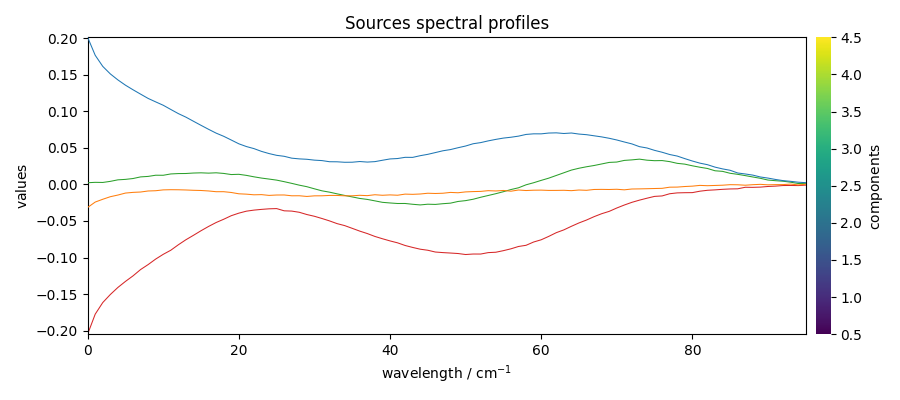
Get the mixing system and source spectral profiles
The mixing system \(A\) and the source spectral profiles \(S^T\) can be obtained as follows (the Sklearn equivalents - also valid with Scpy - are indicated as comments
Plot them
Reconstruct the dataset
The dataset can be reconstructed from these matrices and the mean:
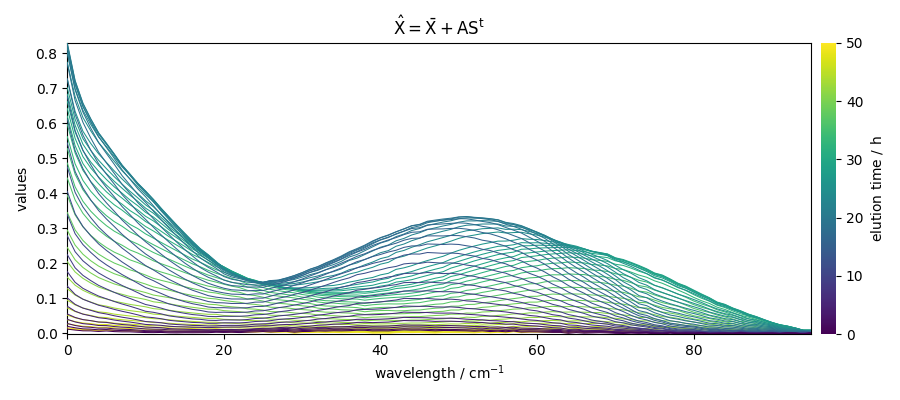
Or using the transform() method:
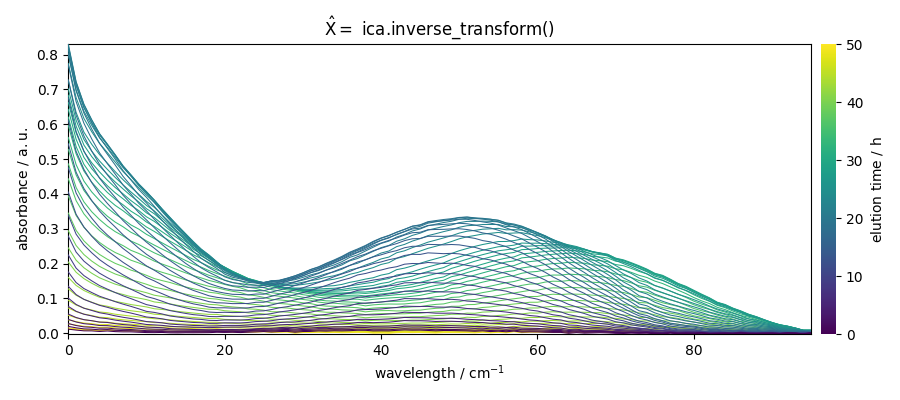
X_hat_b = ica.inverse_transform()
_ = X_hat_b.plot(title=r"$\hat{X} =$ ica.inverse_transform()")
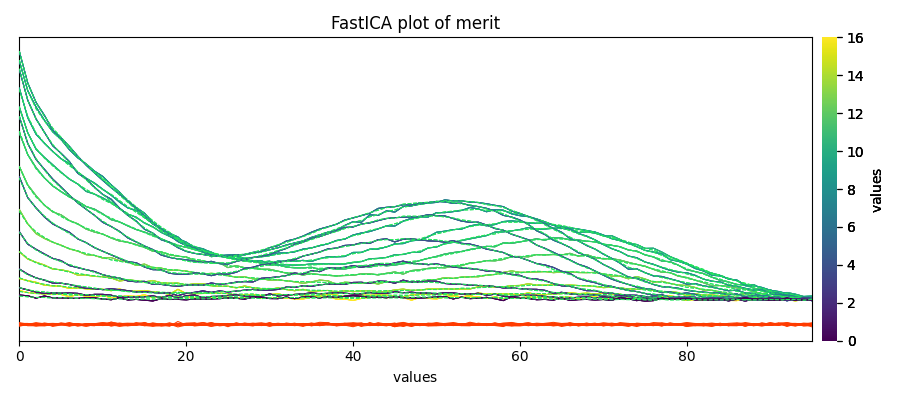
Finally, the quality of the reconstriction can be checked by plot_merit()
_ = ica.plot_merit(nb_traces=15)
This ends the example ! The following line can be uncommented if no plot shows when running the .py script with python
# scp.show()
Total running time of the script: (0 minutes 1.160 seconds)