Note
Go to the end to download the full example code.
Using plot_multiple to plot several datasets on the same figure
In this example, we will display several Raman datasets on the same figure
using the plot_multiple method. Several options are available to customize
the display.
Import spectrochempy as usual
import spectrochempy as scp
Load the data (here 2D spectrum made from a list of 1D spectra):
First we show the basic plot (note here the use of the cmap=None option to
display the spectra with rotating colors. cmap can be of course set to any other
available matplotlib colormap. The second parameter lw is used to set the line
width. In addition, we fix the figsize to have a better view of the spectra.
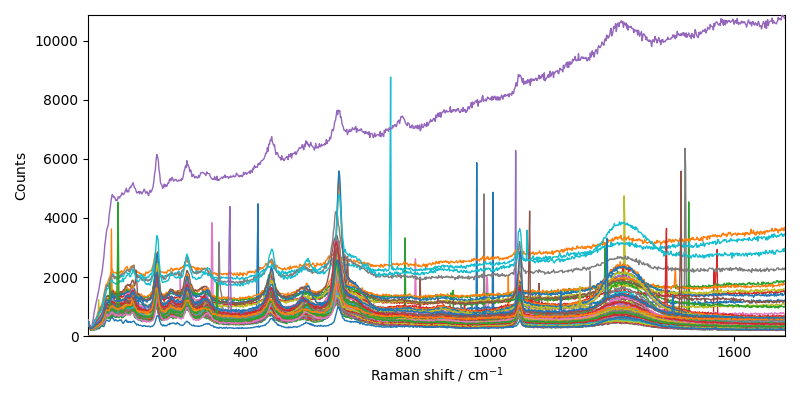
We will limit the x range to the region of interest note the float number to specify that we use coordinates and not indices
As there is obviously a drift in these spectra, we will use detrend to remove it.
B3 = scp.detrend(B2)
_ = B3.plot(cmap=None)
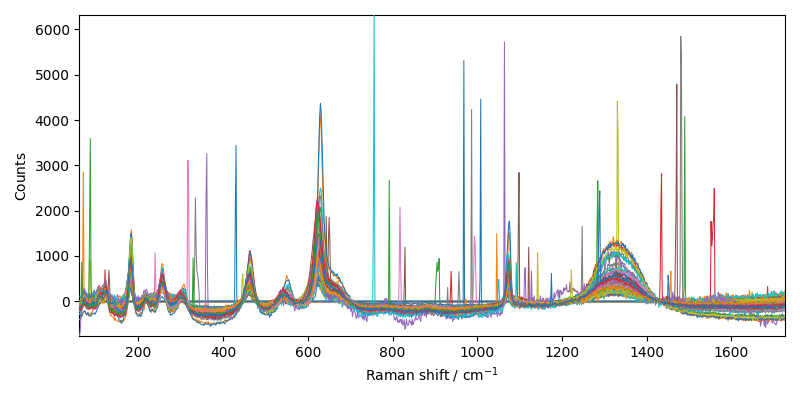
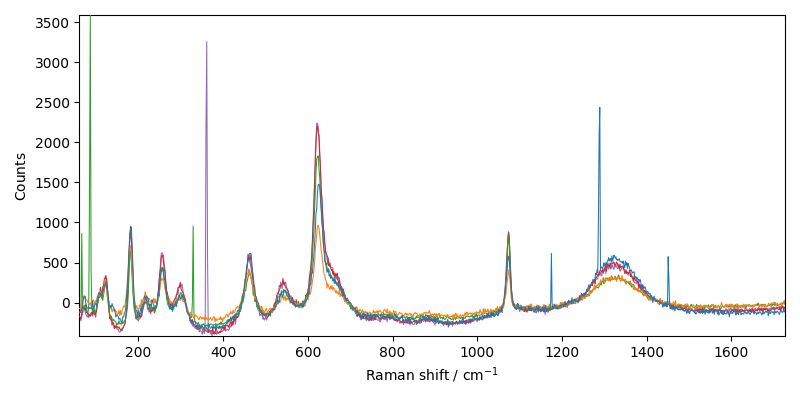
To demonstrate the use of plot_multiple we will take only a few spectra.
For instance the 5 first spectra:
plot it to see what we have selected
Now we will use plot_multiple to plot all the spectra of the dataset B4.
we need to use offset to separate the traces and we set some labels to identify
these traces on the final plot. different colors and line width are also used.
Note that we can use the legend option to place the legend at the best location.
We can also use the shift option to shift the traces vertically.
datasets = list(B4)
_ = scp.plot_multiple(
    datasets,
    method="pen",
    legend="best",
    labels=["A", "B", "C", "D", "E"],
    color=["black", "red", "green", "blue", "violet"],
    lw=[1, 2.5, 1, 1, 1],  # line width (we use here different values)
    ls="-",  # solid line style
    shift=1000,  # vertical shift
)
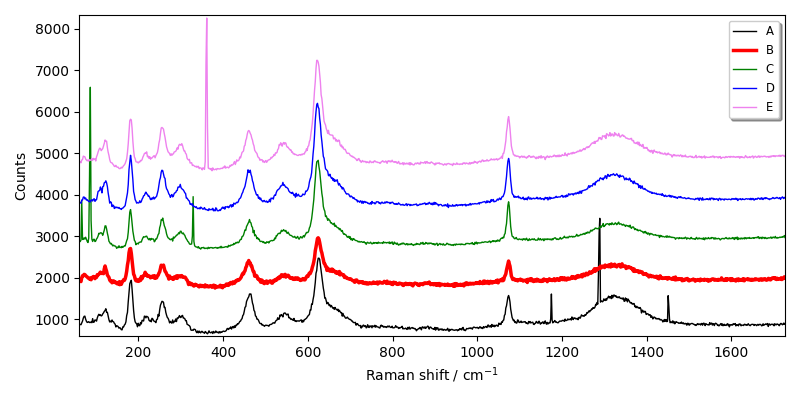
This ends the example ! The following line can be uncommented if no plot shows when running the .py script with python
# scp.show()
Total running time of the script: (0 minutes 1.142 seconds)