spectrochempy.plot
- plot(self, method=None, **kwargs)[source]
Plot the dataset using the specified method.
- Parameters:
dataset (
NDDataset) – Source of data to plot.method (str, optional, default:
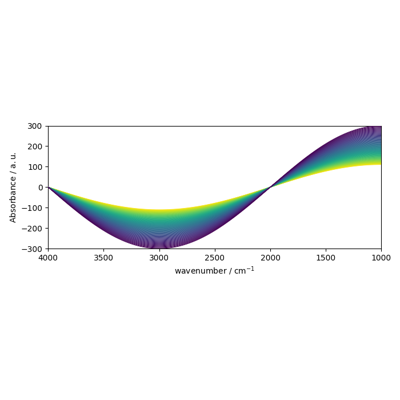
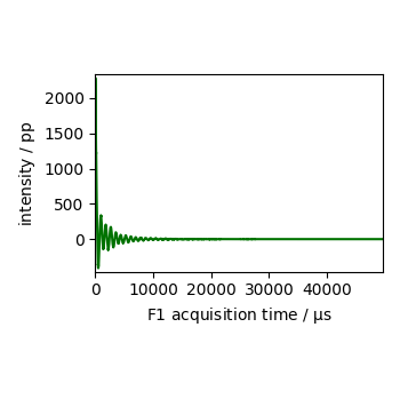
preference.method_1Dorpreference.method_2D) – Name of plotting method to use. If None, method is chosen based on data dimensionality.1D plotting methods:
pen: Solid line plotbar: Bar graphscatter: Scatter plotscatter+pen: Scatter plot with solid line
2D plotting methods:
**kwargs (keyword parameters, optional) – See Other Parameters.
- Other Parameters:
ax (Axe, optional) – Axe where to plot. If not specified, create a new one.
clear (bool, optional, default: True) – If false, hold the current figure and ax until a new plot is performed.
color or c (color, optional, default: auto) – color of the line.
colorbar (bool, optional, default: True) – Show colorbar (2D plots only).
commands (str,) – matplotlib commands to be executed.
data_only (bool, optional, default: False) – Only the plot is done. No addition of axes or label specifications.
dpi (int, optional) – the number of pixel per inches.
figsize (tuple, optional, default is (3.4, 1.7)) – figure size.
fontsize (int, optional) – The font size in pixels, default is 10 (or read from preferences).
imag (bool, optional, default: False) – Show imaginary component for complex data. By default the real component is displayed.
linestyle or ls (str, optional, default: auto) – line style definition.
linewidth or lw (float, optional, default: auto) – line width.
marker, m (str, optional, default: auto) – marker type for scatter plot. If marker != “” then the scatter type of plot is chosen automatically.
markeredgecolor or mec (color, optional)
markeredgewidth or mew (float, optional)
markerfacecolor or mfc (color, optional)
markersize or ms (float, optional)
markevery (None or int)
modellinestyle or modls (str) – line style of the model.
offset (float) – offset of the model individual lines.
output (str,) – name of the file to save the figure.
plot_model (Bool,) – plot model data if available.
plottitle (bool, optional, default: False) – Use the name of the dataset as title. Works only if title is not defined
projections (bool, optional, default: False) – Show projections on the axes (2D plots only).
reverse (bool or None [optional, default=None/False) – In principle, coordinates run from left to right, except for wavenumbers (e.g., FTIR spectra) or ppm (e.g., NMR), that spectrochempy will try to guess. But if reverse is set, then this is the setting which will be taken into account.
show_complex (bool, optional, default: False) – Show both real and imaginary component for complex data. By default only the real component is displayed.
show_mask (bool, optional) – Should we display the mask using colored area.
show_z (bool, optional, default: True) – should we show the vertical axis.
show_zero (bool, optional) – show the zero basis.
style (str, optional, default:
scp.preferences.style(scpy)) – Matplotlib stylesheet (useavailable_styleto get a list of available styles for plotting.title (str) – Title of the plot (or subplot) axe.
transposed (bool, optional, default: False) – Transpose the data before plotting (2D plots only).
twinx (
Axesinstance, optional, default: None) – If this is not None, then a twin axes will be created with a common x dimension.uselabel_x (bool, optional) – use x coordinate label as x tick labels
vshift (float, optional) – vertically shift the line from its baseline.
xlim (tuple, optional) – limit on the horizontal axis.
xlabel (str, optional) – label on the horizontal axis.
x_reverse (bool, optional, default: False) – reverse the x axis. Equivalent to
reverse.ylabel or zlabel (str, optional) – label on the vertical axis.
ylim or zlim (tuple, optional) – limit on the vertical axis.
y_reverse (bool, optional, default: False) – reverse the y axis (2D plot only).
- Returns:
Matplolib Axes or None – The matplotlib axes containing the plot if successful, None otherwise.

