Note
Go to the end to download the full example code.
Reading Renishaw WiRE files
This example shows how to read a Renishaw WiRE files (.wdf format).
The spectral data used has been downloaded from
https://github.com/alchem0x2A/py-wdf-reader (MIT License) and stored in the
local directory ramandata/wire.
The examples given here is a modified version of the original examples: See https://github.com/alchem0x2A/py-wdf-reader/blob/master/examples
First we need to import the spectrochempy API package
import spectrochempy as scp
Import dataset from local files
Read Raman data recorded in WiRe format (.wdf extension).
We just pass the file name as parameter.
First read a single spectrum (measurement type : single)
dataset = scp.read_wire("ramandata/wire/sp.wdf")  # or read_wdf (or read)
_ = dataset.plot()

Now read a series of spectra (measurement type : series) from a Z-depth scan.
dataset = scp.read_wdf("ramandata/wire/depth.wdf")
_ = dataset.plot(method="image")

In this example, the diverging colormap is triggered because the dataset
contains few, but some negative values. If the smaller lobe is at larger than diverging_margin (default 5%) of
the total # range, i.e. if the following condition is satisfied:
To avoid this behavior, you can explicitly enforce a sequential colormap, for example “viridis”:

Alternatively, you can increase the diverging_margin that determines when the
diverging colormap is applied. Then the default sequential colormap (`viridis’) will be used:
_ = dataset.plot(method="image", diverging_margin=0.1)

filter blank spectra

extract a line scan data from a StreamLine HR measurement
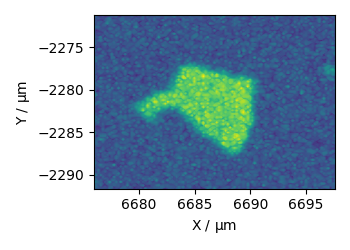
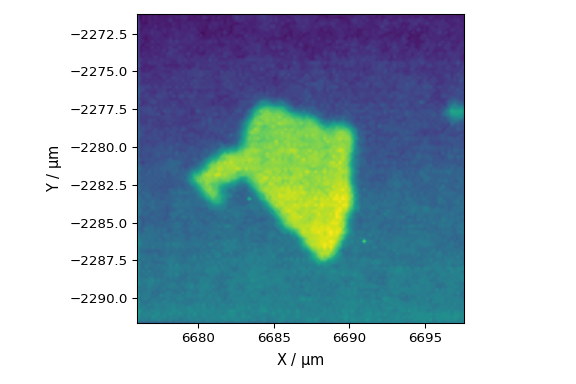
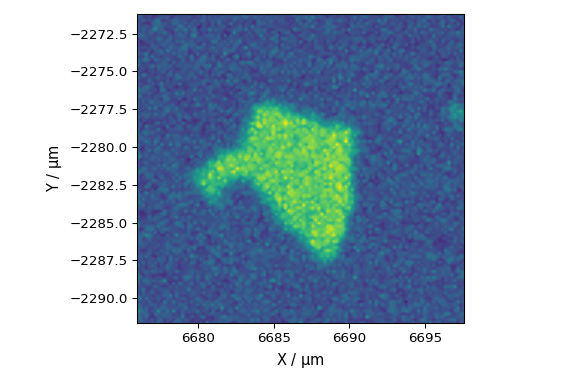
finally extract grid scan data from a StreamLine HR measurement
/home/runner/work/spectrochempy/spectrochempy/src/spectrochempy/core/readers/read_wire.py:190: UserWarning: Map area type is not specified, will assume a xy (column major) scan for the mapping data.
  warning_(
This ends the example ! The following line can be uncommented if no plot shows when running the .py script with python
# scp.show()
Total running time of the script: (0 minutes 6.130 seconds)