Styles
Styles provide theme-level control over visual appearance. They affect fonts, grids, backgrounds, and default colormaps without changing your code.
Available Styles
SpectroChemPy includes several built-in styles:
[1]:
import spectrochempy as scp

ds = scp.read("irdata/nh4y-activation.spg")

# List style files in the stylesheets directory
from pathlib import Path

styles_dir = Path(scp.preferences.stylesheets)
print("Available styles:")
for f in sorted(styles_dir.glob("*.mplstyle")):
    print(f"  - {f.stem}")
Available styles:
  - grayscale
  - mycustom
  - notebook
  - paper
  - poster
  - sans
  - scpy
  - serif
  - talk
Applying a Style
Apply a style to a single plot:
[2]:
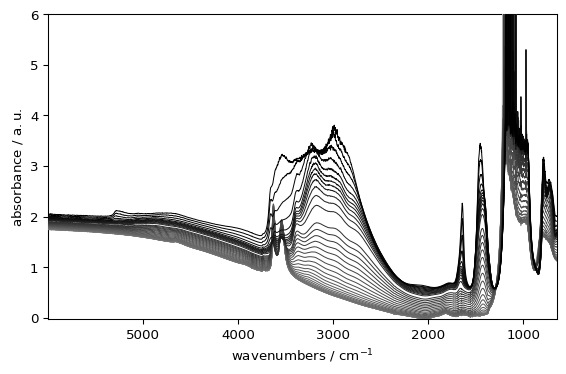
_ = ds.plot(style="grayscale")
Combining Style with Options
Styles work with all other plot options:
[3]:
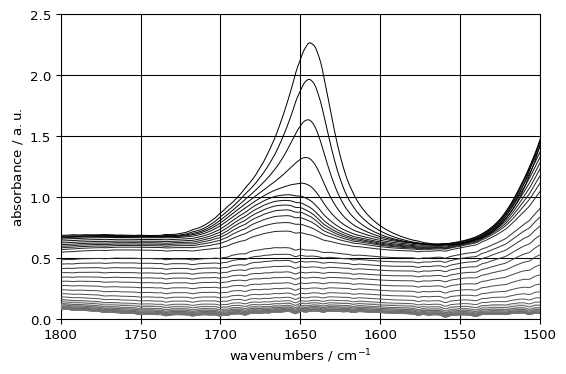
_ = ds.plot(style="grayscale", xlim=(1800, 1500), ylim=(0, 2.5), grid=True)
Setting a Default Style
Make a style persistent across your session and future sessions by setting it in preferences:
[4]:
original_style = scp.preferences.style
scp.preferences.style = "grayscale"
_ = ds.plot()

[5]:
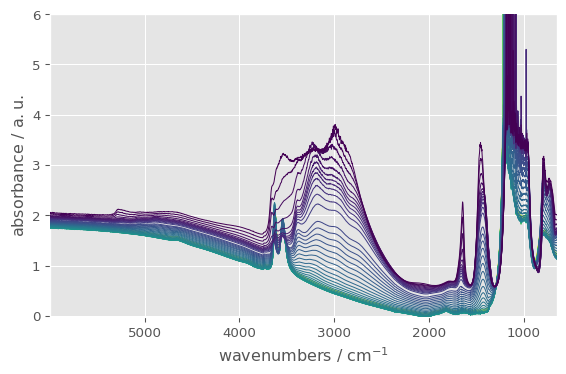
scp.preferences.style = "ggplot"
_ = ds.plot()
Reset to default:
[6]:
scp.preferences.style = original_style
Style Characteristics
Style |
Characteristics |
|---|---|
|
Default SpectroChemPy appearance |
|
Grayscale colors, sets image.cmap to “gray” |
|
Serif fonts |
|
Sans-serif fonts |
|
Smaller fonts, higher DPI |
|
Optimized for Jupyter |
|
Large fonts for presentations |
|
Very large fonts |
Creating Custom Styles
You can create your own style based on current preferences:
[7]:
# Set preferences
prefs = scp.preferences
prefs.colormap_sequential = "jet"
prefs.font.family = "monospace"
prefs.font.size = 30
prefs.axes.grid = True
# Create a custom style
prefs.makestyle("mycustom")
# Reset to defaults
prefs.reset()
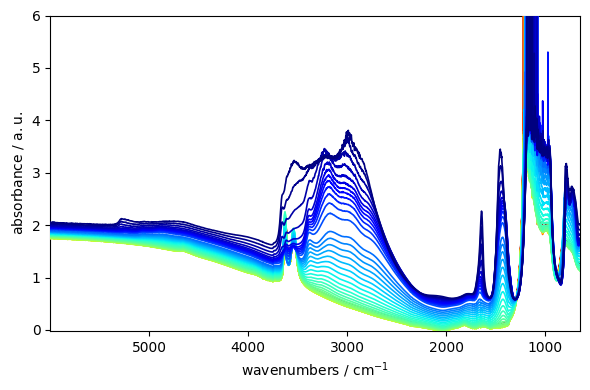
# Now use your custom style
_ = ds.plot(style="mycustom")
How Styles Affect Colormaps
Styles affect colormaps only when:
The style explicitly sets
image.cmapin its definitionprefs.colormapis set to “auto” (the default)
The grayscale style sets image.cmap = "gray", so it changes the colormap when prefs.colormap = "auto". If you set a specific prefs.colormap, the style will not override it.
Best Practice
Use styles for theme-level changes (publication, presentation)
Use kwargs for plot-specific adjustments
Use preferences for session defaults
This separation keeps your code flexible and reproducible.