Note
Go to the end to download the full example code.
Cross-validation of corn moisture models
This example evaluates fixed PLS configurations on real near-infrared corn spectra. It shows out-of-fold predictions, global metrics, and fold-local preprocessing without using the validation observations during fitting.
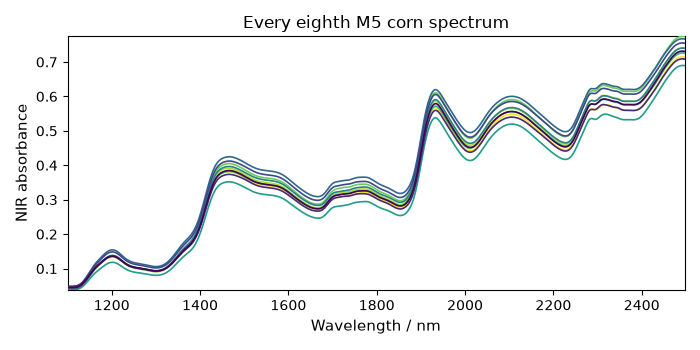
The public Eigenvector Corn data contain 80 corn samples measured on three instruments, with reference values for moisture, oil, protein, and starch. The measurements were made at Cargill and are distributed by Eigenvector with permission. Here we use only the M5 spectra and moisture.
Import packages
from sklearn.model_selection import KFold

import spectrochempy as scp
Load and identify the data
The remote archive is an existing SpectroChemPy example dependency. A failed download raises normally, so a documentation build cannot silently publish a partially executed analysis.
datasets = scp.read("https://www.eigenvector.com/data/Corn/corn.mat", merge=False)
X = next(dataset for dataset in datasets if dataset.name == "m5spec").copy()
properties = next(dataset for dataset in datasets if dataset.name == "propvals").copy()
y = properties[:, "Moisture"].squeeze()

X.title = "NIR absorbance"
X.x.title = "Wavelength"
X.x.units = "nm"
X.y.title = "sample"
y.title = "Moisture content"
y.units = "%"
y.y.title = "sample"

print(f"Spectra: {X.shape}, dimensions {tuple(X.dims)}")
print(f"Target: {y.shape}, dimensions {tuple(y.dims)}")
print(f"Wavelength range: {X.x.data[0]:.0f}–{X.x.data[-1]:.0f} {X.x.units}")
print(f"Moisture range: {y.data.min():.3f}–{y.data.max():.3f} {y.units}")

ax = X[::8].plot(cmap="viridis", show=False)
_ = ax.set_title("Every eighth M5 corn spectrum")
Spectra: (80, 700), dimensions ('y', 'x')
Target: (80,), dimensions ('y',)
Wavelength range: 1100–2498 nm
Moisture range: 9.377–10.993 %
Define one validation design
There is one M5 spectrum per sample and the distributed file does not expose a batch or replicate grouping. We therefore use a reproducible shuffled K-fold design, without inventing groups. A domain analysis should use grouped cross-validation when its experimental design identifies dependent samples.
Five PLS components match the established fixed configuration used in the SpectroChemPy corn tutorial. They are fixed before this comparison and are not selected from the scores below.
splitter = KFold(n_splits=5, shuffle=True, random_state=7)
metrics = ("rmsecv", "r2", "bias", "mae")

pls = scp.PLSRegression(n_components=5)
pls_result = scp.cross_validate(pls, X, y, cv=splitter, metrics=metrics)
Add fold-local scatter correction
NIR spectra commonly exhibit multiplicative scatter. With no explicit
reference, MSCTransformer learns the mean reference spectrum during
fit. Keeping it inside the Pipeline therefore learns a different
reference from each fold’s calibration spectra only; there is no global MSC
reference and no validation leakage.
msc_pls = scp.Pipeline(
    [
        ("msc", scp.MSCTransformer(dim="y")),
        ("pls", scp.PLSRegression(n_components=5)),
    ]
)
msc_result = scp.cross_validate(msc_pls, X, y, cv=splitter, metrics=metrics)


def _metric_value(result, name):
    return float(result.metric(name).values.data.squeeze())
Inspect global OOF metrics
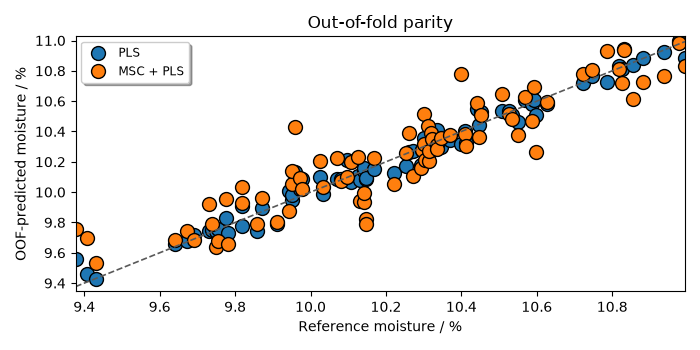
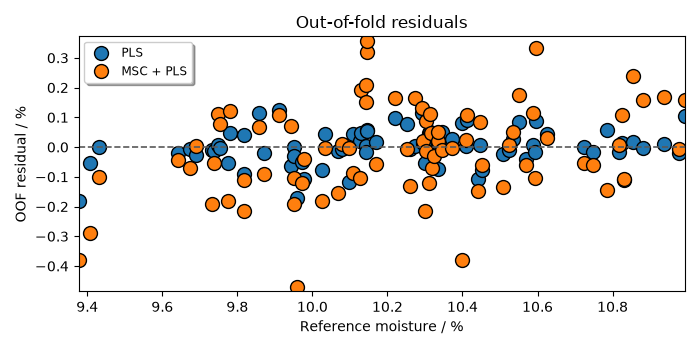
RMSECV, bias, and MAE retain the moisture unit; R² is unitless. Global RMSECV is calculated from all OOF residuals together: it is the square root of the fold-size-weighted mean of squared fold RMSE values, not their arithmetic mean. The comparison is descriptive: this example does not claim that MSC should improve this dataset or use the displayed scores to select a model.
print("model            RMSECV (%)      R2     bias (%)      MAE (%)")
for label, result in (("PLS", pls_result), ("MSC + PLS", msc_result)):
    print(
        f"{label:12s} "
        f"{_metric_value(result, 'rmsecv'):12.4f} "
        f"{_metric_value(result, 'r2'):7.4f} "
        f"{_metric_value(result, 'bias'):12.4f} "
        f"{_metric_value(result, 'mae'):12.4f}"
    )
model            RMSECV (%)      R2     bias (%)      MAE (%)
PLS                0.0602  0.9747      -0.0014       0.0441
MSC + PLS          0.1533  0.8355       0.0094       0.1183
Plot parity and residuals with NDDataset
Both result objects preserve the original sample order and target geometry. The observed moisture values become the coordinate of small plotting datasets, so the plots use the regular SpectroChemPy 1D plotting API. These plotting datasets alone are sorted by reference moisture to provide the monotonic coordinate expected by a 1D plot; the OOF result order is unchanged.
observed = pls_result.observed.data.squeeze()
pls_predicted = pls_result.oof_predictions.data.squeeze()
msc_predicted = msc_result.oof_predictions.data.squeeze()

plot_order = observed.argsort()
reference_moisture = scp.Coord(
    observed[plot_order], title="Reference moisture", units="%"
)
parity_datasets = [
    scp.NDDataset(
        prediction[plot_order],
        coordset=[reference_moisture.copy()],
        dims=["x"],
        title="OOF-predicted moisture",
        units="%",
    )
    for prediction in (pls_predicted, msc_predicted)
]
identity = scp.NDDataset(
    observed[plot_order],
    coordset=[reference_moisture.copy()],
    dims=["x"],
    title="OOF-predicted moisture",
    units="%",
)
parity_ax = scp.plot_multiple(
    parity_datasets,
    method="scatter",
    pen=False,
    labels=["PLS", "MSC + PLS"],
    legend="best",
    title="Out-of-fold parity",
    show=False,
)
_ = identity.plot_pen(
    ax=parity_ax,
    clear=False,
    color="0.35",
    ls="--",
    label="identity",
    legend=True,
    show=False,
)

residual_datasets = [
    scp.NDDataset(
        (observed - prediction)[plot_order],
        coordset=[reference_moisture.copy()],
        dims=["x"],
        title="OOF residual",
        units="%",
    )
    for prediction in (pls_predicted, msc_predicted)
]
zero_residual = scp.NDDataset(
    observed[plot_order] * 0.0,
    coordset=[reference_moisture.copy()],
    dims=["x"],
    title="OOF residual",
    units="%",
)
residual_ax = scp.plot_multiple(
    residual_datasets,
    method="scatter",
    pen=False,
    labels=["PLS", "MSC + PLS"],
    legend="best",
    title="Out-of-fold residuals",
    show=False,
)
_ = zero_residual.plot_pen(
    ax=residual_ax,
    clear=False,
    color="0.35",
    ls="--",
    label="zero residual",
    legend=True,
    show=False,
)
The template estimators remain unfitted. cross_validate fits independent
clones inside each fold and does not perform a final fit on all 80 samples.
print(f"Supplied PLS fitted: {pls._fitted}")
print(f"Supplied Pipeline fitted: {msc_pls._fitted}")
print(f"OOF sample order preserved: {pls_result.observed.y == y.y}")
Supplied PLS fitted: False
Supplied Pipeline fitted: False
OOF sample order preserved: True
Uncomment the following line to display all figures when running the script directly with Python.
# scp.show()
Total running time of the script: (0 minutes 3.501 seconds)