Note
Go to the end to download the full example code.
Mask a saturated region and transform an IR dataset
This example shows three common operations on a 2D infrared dataset: masking a saturated region, transposing the dataset, and converting axis units.
import spectrochempy as scp
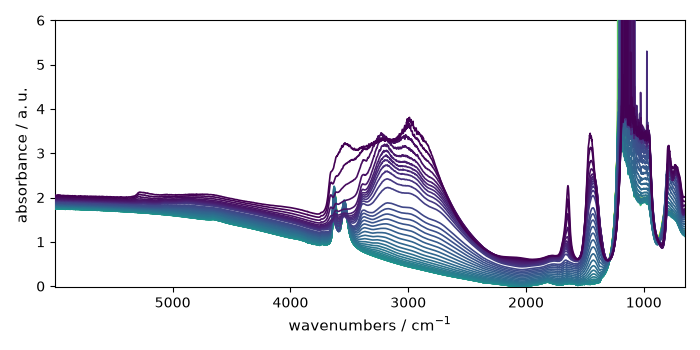
Load a stacked IR dataset and convert the acquisition axis to hours.
dataset = scp.read_omnic("irdata/nh4y-activation.spg")
dataset.y -= dataset.y[0]
dataset.y.title = "time"

prefs = scp.preferences
prefs.figure.figsize = (7, 3.5)
prefs.colormap = "Dark2"
prefs.colorbar = True
_ = dataset.plot()
Mask the saturated region around 1100 cm^-1.
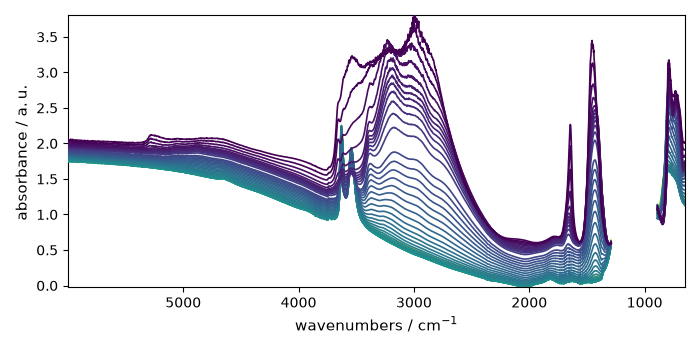
The mask is then respected by subsequent operations such as reductions.
dataset.max()
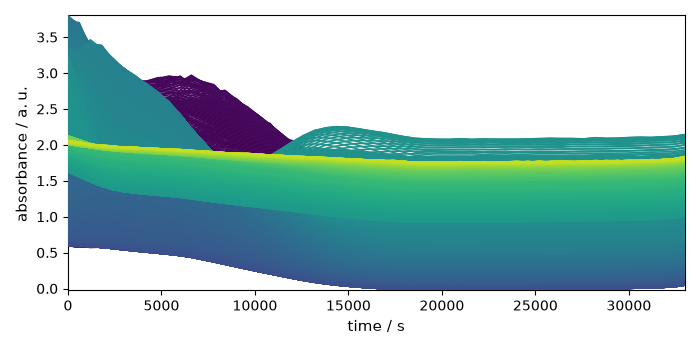
Transposition exchanges the dataset axes while preserving the data and mask.
transposed = dataset.T
_ = transposed.plot()
Compatible unit conversions can be applied to coordinates in place.
dataset.y.ito("hours")
_ = dataset.plot()

This ends the example. Uncomment the next line to display the figures when running the script directly with Python.
# scp.show()
Total running time of the script: (0 minutes 3.609 seconds)