Note
Go to the end to download the full example code.
Find peak maxima in an IR time series
This example shows a compact workflow to locate peak maxima on an IR dataset and visualize the detected positions on top of the last spectrum.
import spectrochempy as scp


def _as_iterable(values):
    if getattr(values, "shape", ()) == ():
        return [values]
    return values


def _tracked_peak_position(spec):
    peaks, _ = spec.find_peaks(distance="5 cm^-1", prominence=0.02)
    if peaks is not None:
        return peaks.x.values.max()

    index = spec.data.argmax()
    return spec.x[index].values
Load a time-resolved IR dataset and express the acquisition axis in minutes.
dataset = scp.read("irdata/CO@Mo_Al2O3.SPG")
dataset.y -= dataset.y.data[0]
dataset.y.title = "time"
dataset.y = dataset.y.to("minutes")
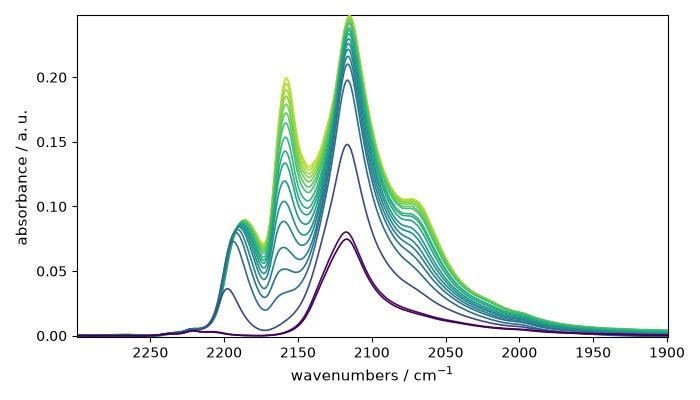
Focus on the carbonyl region.
region = dataset[:, 2300.0:1900.0]
prefs = scp.preferences
prefs.figure.figsize = (7, 4)
prefs.colormap = "Dark2"
prefs.colorbar = True
_ = region.plot()
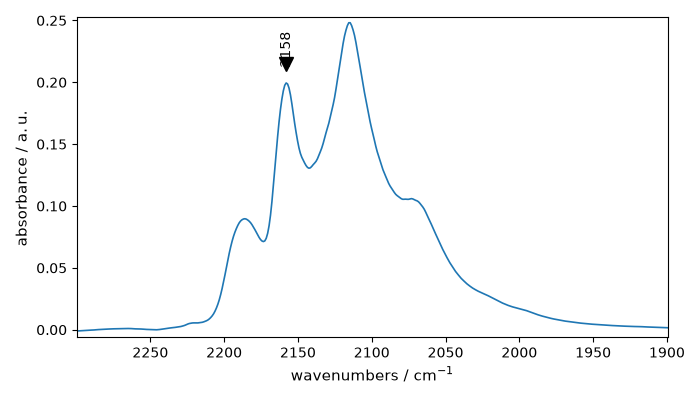
Peak finding can use spacing constraints directly in coordinate units when the spectral axis is linear.
last = region[-1]
peaks, properties = last.find_peaks(distance="5 cm^-1", prominence=0.02)
peaks.x.values
Plot the detected maxima on top of the last spectrum.
ax = last.plot_pen()
markers = peaks + 0.015
_ = markers.plot_scatter(
    ax=ax,
    clear=False,
    data_only=True,
    marker="v",
    color="black",
)

for x, y in zip(
    _as_iterable(markers.x.values),
    _as_iterable(markers.values),
    strict=False,
):
    _ = ax.annotate(
        f"{x.m:0.0f}",
        xy=(x.m, y.m),
        xytext=(-5, 0),
        rotation=90,
        textcoords="offset points",
    )
The optional properties dictionary can be useful to inspect how the peaks were selected.
sorted(properties)
['left_bases', 'prominences', 'right_bases']
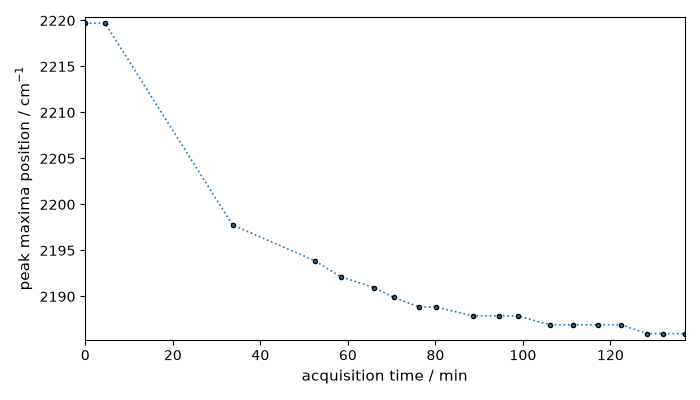
The same logic can be applied to each spectrum of the time series. Here we follow one band in a restricted region so each spectrum contributes one peak position.
tracked_region = region[:, 2220.0:2180.0]
positions = [_tracked_peak_position(spec) for spec in tracked_region]

evolution = scp.NDDataset(positions, title="peak maxima position")
evolution.x = scp.Coord(region.y, title="acquisition time")
evolution.units = "cm^-1"
_ = evolution.plot(ls=":", marker="o", ms=3)
This ends the example. Uncomment the next line to display the figures when running the script directly with Python.
# scp.show()
Total running time of the script: (0 minutes 1.409 seconds)