Note
Go to the end to download the full example code.
Apply built-in plotting styles
This example shows how to switch between built-in plotting styles for a single dataset without changing the plotting code itself.
from pathlib import Path

import spectrochempy as scp
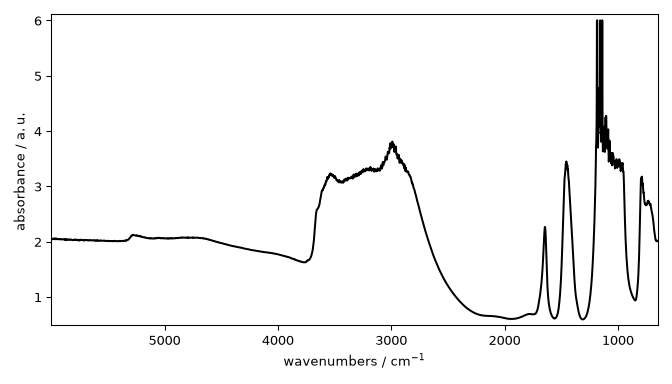
Load an IR dataset and inspect the available styles.
dataset = scp.read("irdata/nh4y-activation.spg")[0]

styles_dir = Path(scp.preferences.stylesheets)
available_styles = sorted(f.stem for f in styles_dir.glob("*.mplstyle"))
print(available_styles[:8])
['grayscale', 'mycustom', 'notebook', 'paper', 'poster', 'sans', 'scpy', 'serif']
Apply a style to one plot only.
_ = dataset.plot(style="grayscale")
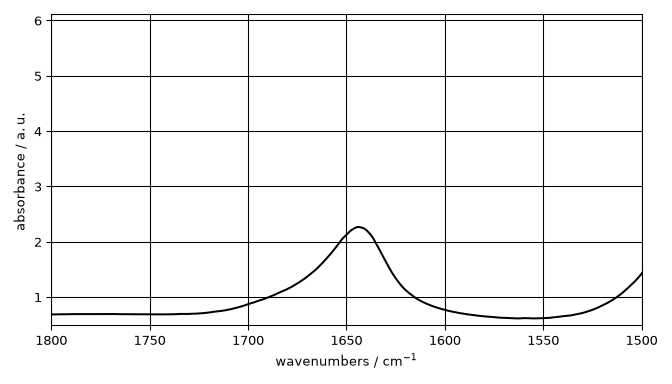
Styles combine naturally with ordinary plot options.
_ = dataset.plot(style="grayscale", xlim=(1800, 1500), grid=True)
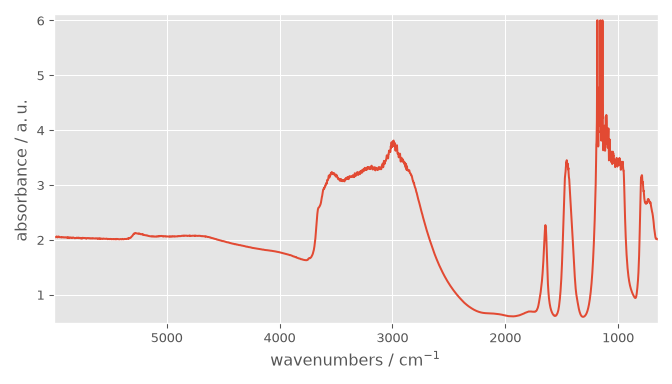
Session-level defaults can also be changed through preferences.
This ends the example. Uncomment the next line to display the figures when running the script directly with Python.
# scp.show()
Total running time of the script: (0 minutes 0.443 seconds)