spectrochempy.plot_compare
- plot_compare(X, X_ref, *, ax=None, clear=True, residual=True, title=None, show_yaxis=True, show=True, exp_c=None, calc_c=None, resid_c=None, exp_linestyle='-', calc_linestyle='--', resid_linestyle='-', exp_linewidth=1.0, calc_linewidth=1.6, resid_linewidth=1.0, exp_label=None, calc_label=None, resid_label='difference', legend_loc='best', kind=None, method=None, offset=None, nb_traces='all', **kwargs)[source]
Compare two datasets (X vs X_ref) with optional residual.
- Parameters:
X (NDDataset) – reference dataset.
X_ref (NDDataset) – Dataset to compare against (e.g., reconstructed).
residual (bool, optional) – Whether to plot residual X - X_ref.
Examples using spectrochempy.plot_compare
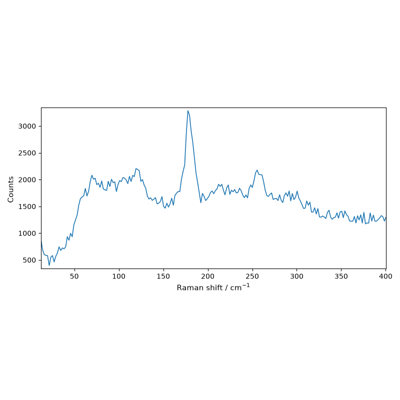
Compare smoothing window sizes on a Raman spectrum
Compare smoothing window sizes on a Raman spectrum